33
/
AIzaSyB4mHJ5NPEv-XzF7P6NDYXjlkCWaeKw5bc
November 30, 2025
94502
Burkina Faso
BFA
true
2
1
Antiretroviral therapy coverage (% of people living with HIV)
2016,2015,2014,2013,2012,2011,2010,2009,2008,2007,2006,2005,2004,2003,2002,2001
Create a timeline
Public Timelines
For education
For educational institutions
For teachers
For students
Cabinet
For educational institutions
For teachers
For students
Open cabinet
FAQ
Close
Create a timeline
Public timelines
FAQ
About & Feedback
Terms
Privacy
FAQ
Support 24/7
Cabinet
Get premium
Donate
Download
Global statistics library
→
Burkina Faso
→
Antiretroviral therapy coverage (% of people living with HIV)
This statistics in other country:
Afghanistan
Algeria
Angola
Arab World
Argentina
Armenia
Australia
Azerbaijan
Bahamas, The
Bangladesh
Barbados
Belarus
Belize
Benin
Bolivia
Botswana
Brazil
Burkina Faso
Burundi
Cabo Verde
Cambodia
Cameroon
Caribbean small states
Central African Republic
Chad
Chile
Congo, Dem. Rep.
Costa Rica
Cote d'Ivoire
Cuba
Djibouti
Dominican Republic
Early-demographic dividend
Ecuador
Egypt, Arab Rep.
El Salvador
Equatorial Guinea
Eritrea
Fragile and conflict affected situations
Gabon
Gambia, The
Georgia
Ghana
Guatemala
Guinea
Guyana
Haiti
Heavily indebted poor countries (HIPC)
Honduras
IDA blend
IDA only
IDA total
India
Indonesia
Iran, Islamic Rep.
Jamaica
Kazakhstan
Kenya
Kyrgyz Republic
Latin America & Caribbean
Latin America & Caribbean (excluding high income)
Latin America & the Caribbean (IDA & IBRD countries)
Latvia
Least developed countries: UN classification
Lebanon
Lesotho
Liberia
Low income
Lower middle income
Madagascar
Malawi
Malaysia
Mali
Mauritania
Mauritius
Mexico
Middle East & North Africa
Middle East & North Africa (excluding high income)
Middle East & North Africa (IDA & IBRD countries)
Moldova
Mongolia
Morocco
Mozambique
Myanmar
Namibia
Nepal
Nicaragua
Niger
Pakistan
Panama
Papua New Guinea
Paraguay
Peru
Philippines
Pre-demographic dividend
Rwanda
Senegal
Sierra Leone
Somalia
South Africa
South Asia
South Asia (IDA & IBRD)
South Sudan
Spain
Sri Lanka
Sub-Saharan Africa
Sub-Saharan Africa (excluding high income)
Sub-Saharan Africa (IDA & IBRD countries)
Sudan
Suriname
Swaziland
Tajikistan
Tanzania
Thailand
Togo
Trinidad and Tobago
Tunisia
Uganda
Ukraine
Uruguay
Uzbekistan
Venezuela, RB
Vietnam
World
Yemen, Rep.
Zambia
Zimbabwe
Timeline:
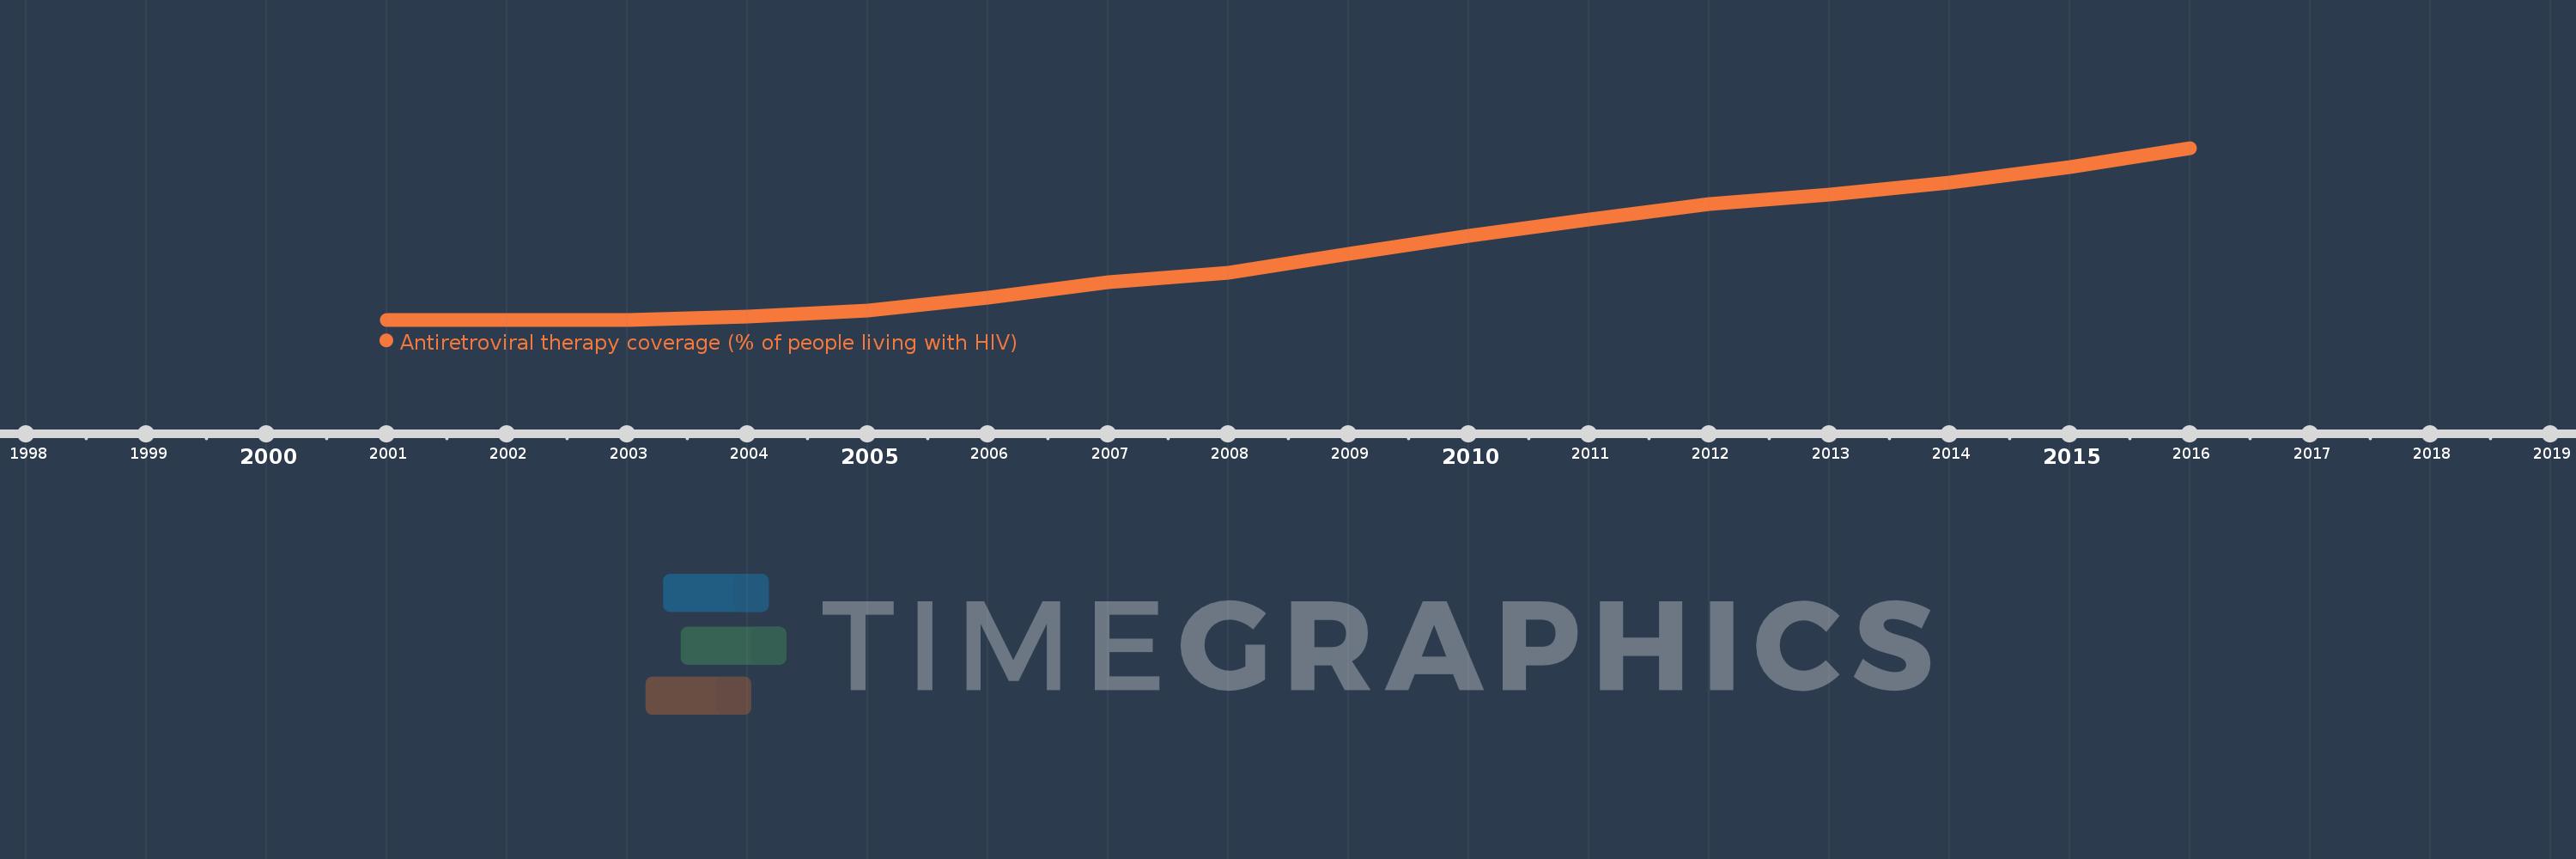
This timeline shows a graph from
2001
to
2016
of Burkina Faso. No data until
2000
. Number of actual observations by date:
16
.
Source name:
World Development Indicators
Source organization:
UNAIDS estimates.
Categories, topics:
Health
Last updated:
apr 23, 2017
Indicators value changes by year
Meaning:
21.438
Minimum:
0.0
jan 1, 2001
Maximum:
55.0
jan 1, 2016
At the date of observation
Value
Absolute change
Change from the previous value
jan 1, 2001
0.0
0.0
0.0%
jan 1, 2002
0.0
0.0
%
jan 1, 2003
0.0
0.0
%
jan 1, 2004
1.0
+1.0
%
jan 1, 2005
3.0
+2.0
200.0%
jan 1, 2006
7.0
+4.0
133.33%
jan 1, 2007
12.0
+5.0
71.43%
jan 1, 2008
15.0
+3.0
25.0%
jan 1, 2009
21.0
+6.0
40.0%
jan 1, 2010
27.0
+6.0
28.57%
jan 1, 2011
32.0
+5.0
18.52%
jan 1, 2012
37.0
+5.0
15.63%
jan 1, 2013
40.0
+3.0
8.11%
jan 1, 2014
44.0
+4.0
10.0%
jan 1, 2015
49.0
+5.0
11.36%
jan 1, 2016
55.0
+6.0
12.24%
Ranking of countries by current statistics by years
About & Feedback
Terms
Privacy
FAQ
Support 24/7
Cabinet
Get premium
Donate
The service accepts bank transfer (ACH, Wire) or cards (Visa, MasterCard, etc). Processed by Stripe.
Secured with SSL