33
/
AIzaSyB4mHJ5NPEv-XzF7P6NDYXjlkCWaeKw5bc
November 30, 2025
93400
Bulgaria
BGR
true
2
1
Debt stock reduction (current US$)
2016,2015,2014,2010,2009,2002,2001,2000,1998,1997,1995
Create a timeline
Public Timelines
For education
For educational institutions
For teachers
For students
Cabinet
For educational institutions
For teachers
For students
Open cabinet
FAQ
Close
Create a timeline
Public timelines
FAQ
About & Feedback
Terms
Privacy
FAQ
Support 24/7
Cabinet
Get premium
Donate
Download
Global statistics library
→
Bulgaria
→
Debt stock reduction (current US$)
This statistics in other country:
Afghanistan
Albania
Algeria
Angola
Argentina
Armenia
Azerbaijan
Bangladesh
Belarus
Belize
Benin
Bhutan
Bolivia
Bosnia and Herzegovina
Botswana
Brazil
Bulgaria
Burkina Faso
Burundi
Cabo Verde
Cambodia
Cameroon
Central African Republic
Chad
China
Colombia
Comoros
Congo, Dem. Rep.
Congo, Rep.
Costa Rica
Cote d'Ivoire
Djibouti
Dominica
Dominican Republic
East Asia & Pacific (excluding high income)
Ecuador
Egypt, Arab Rep.
El Salvador
Eritrea
Ethiopia
Europe & Central Asia (excluding high income)
Fiji
Gabon
Gambia, The
Georgia
Ghana
Grenada
Guatemala
Guinea
Guinea-Bissau
Guyana
Haiti
Honduras
IDA only
India
Indonesia
Jamaica
Jordan
Kazakhstan
Kenya
Kosovo
Kyrgyz Republic
Lao PDR
Latin America & Caribbean (excluding high income)
Lebanon
Lesotho
Liberia
Low & middle income
Low income
Lower middle income
Macedonia, FYR
Madagascar
Malawi
Maldives
Mali
Mauritania
Mauritius
Mexico
Middle East & North Africa (excluding high income)
Middle income
Moldova
Mongolia
Montenegro
Morocco
Mozambique
Myanmar
Nepal
Nicaragua
Niger
Nigeria
Pakistan
Panama
Papua New Guinea
Paraguay
Peru
Philippines
Romania
Russian Federation
Rwanda
Samoa
Sao Tome and Principe
Senegal
Serbia
Sierra Leone
Solomon Islands
Somalia
South Africa
South Asia
Sri Lanka
St. Lucia
St. Vincent and the Grenadines
Sub-Saharan Africa (excluding high income)
Sudan
Swaziland
Tajikistan
Tanzania
Thailand
Togo
Tonga
Tunisia
Turkey
Turkmenistan
Uganda
Ukraine
Upper middle income
Uzbekistan
Vanuatu
Venezuela, RB
Vietnam
Yemen, Rep.
Zambia
Zimbabwe
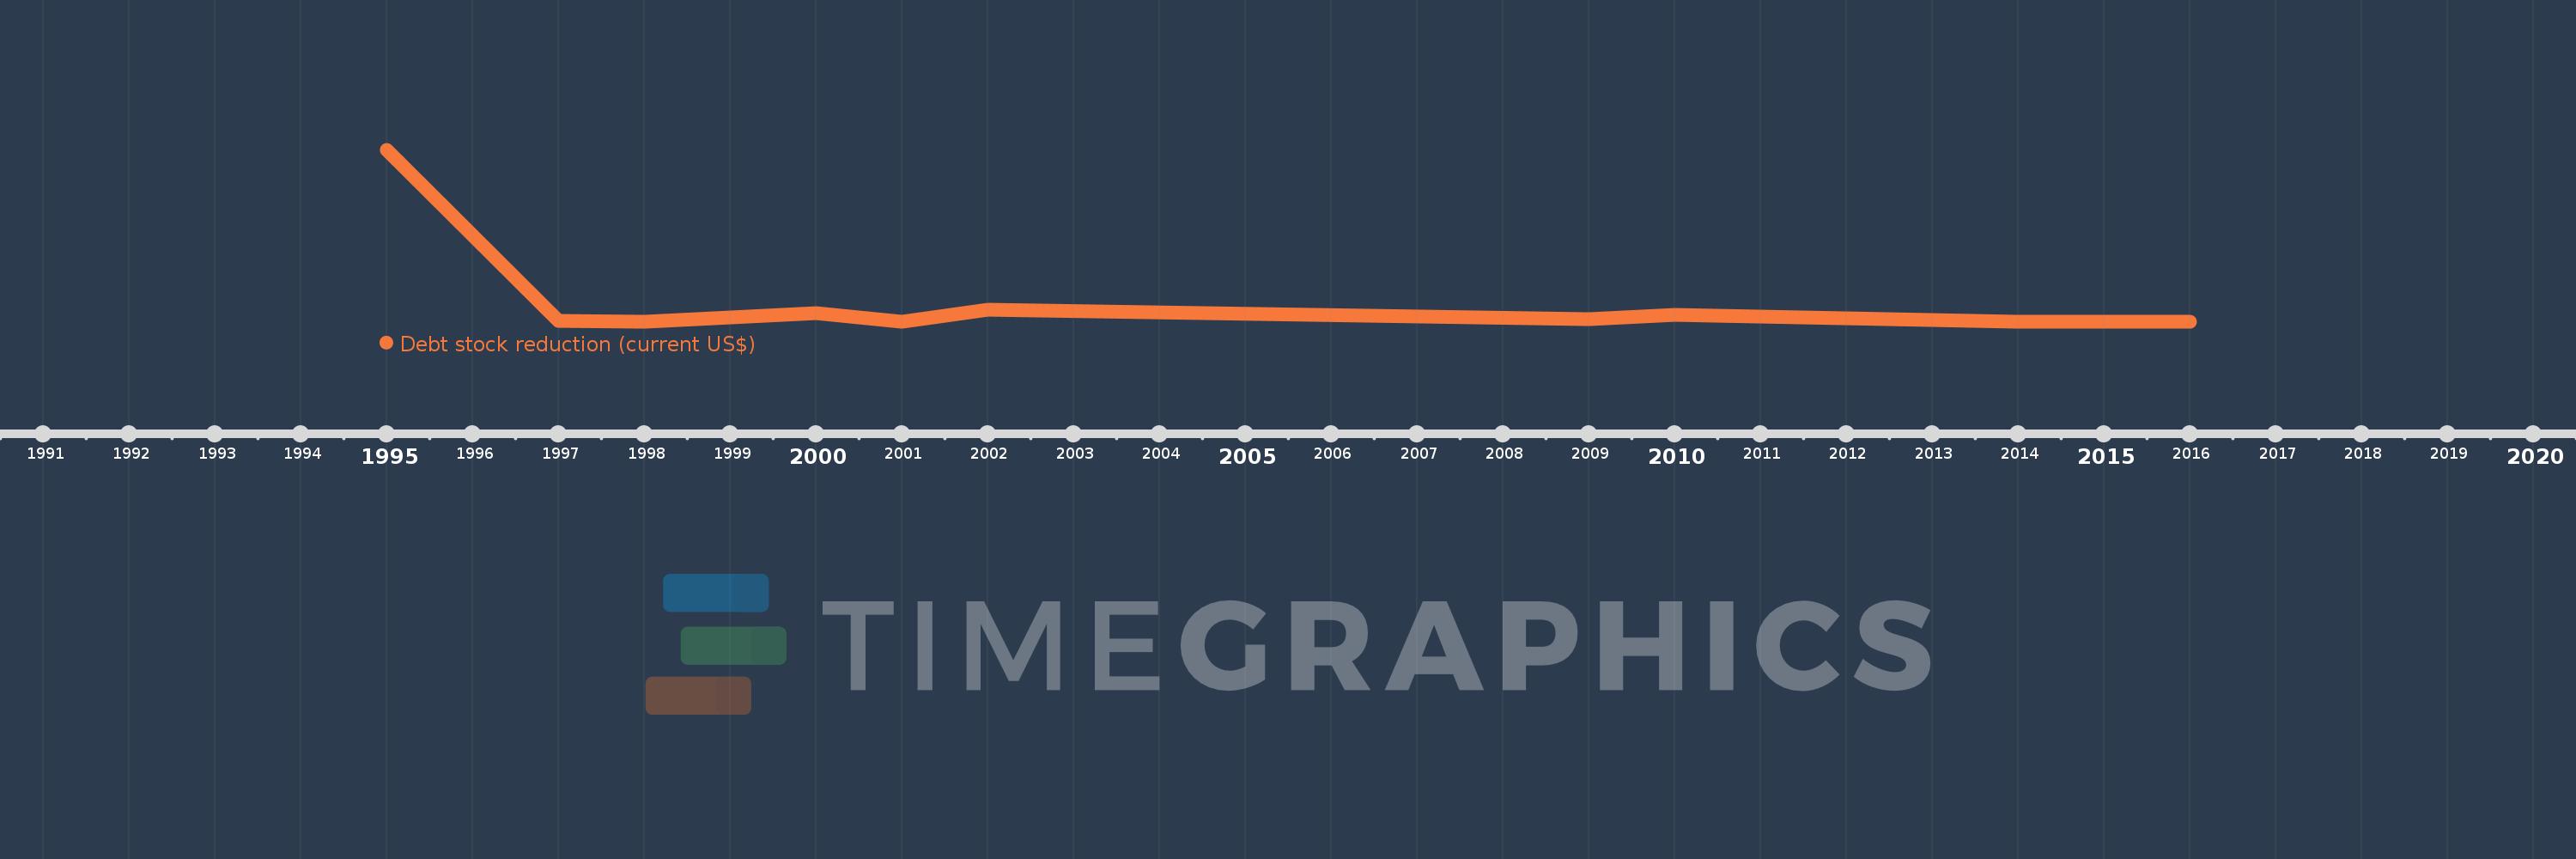
Timeline:
This timeline shows a graph from
1995
to
2016
of Bulgaria. No data until
1994
. Number of actual observations by date:
11
.
Source name:
World Development Indicators
Source organization:
World Bank, International Debt Statistics.
Categories, topics:
External Debt
Last updated:
apr 23, 2017
Indicators value changes by year
Meaning:
310.475 mln
Minimum:
0.0
jan 1, 2015
Maximum:
2.871 bln
jan 1, 1995
At the date of observation
Value
Absolute change
Change from the previous value
jan 1, 1995
2.871 bln
+2.871 bln
0.0%
jan 1, 1997
16.1 mln
-2.855 bln
-99.44%
jan 1, 1998
6.599 mln
-9.501 mln
-59.01%
jan 1, 2000
150.34 mln
+143.741 mln
2.18K%
jan 1, 2001
1.334 mln
-149.006 mln
-99.11%
jan 1, 2002
201.0 mln
+199.666 mln
14.97K%
jan 1, 2009
44.805 mln
-156.195 mln
-77.71%
jan 1, 2010
122.888 mln
+78.083 mln
174.27%
jan 1, 2014
959.0K
-121.929 mln
-99.22%
jan 1, 2015
0.0
-959.0K
-100.0%
jan 1, 2016
0.0
0.0
%
Ranking of countries by current statistics by years
About & Feedback
Terms
Privacy
FAQ
Support 24/7
Cabinet
Get premium
Donate
The service accepts bank transfer (ACH, Wire) or cards (Visa, MasterCard, etc). Processed by Stripe.
Secured with SSL