33
/
AIzaSyB4mHJ5NPEv-XzF7P6NDYXjlkCWaeKw5bc
November 1, 2025
92243
British Virgin Islands
VGB
true
2
1
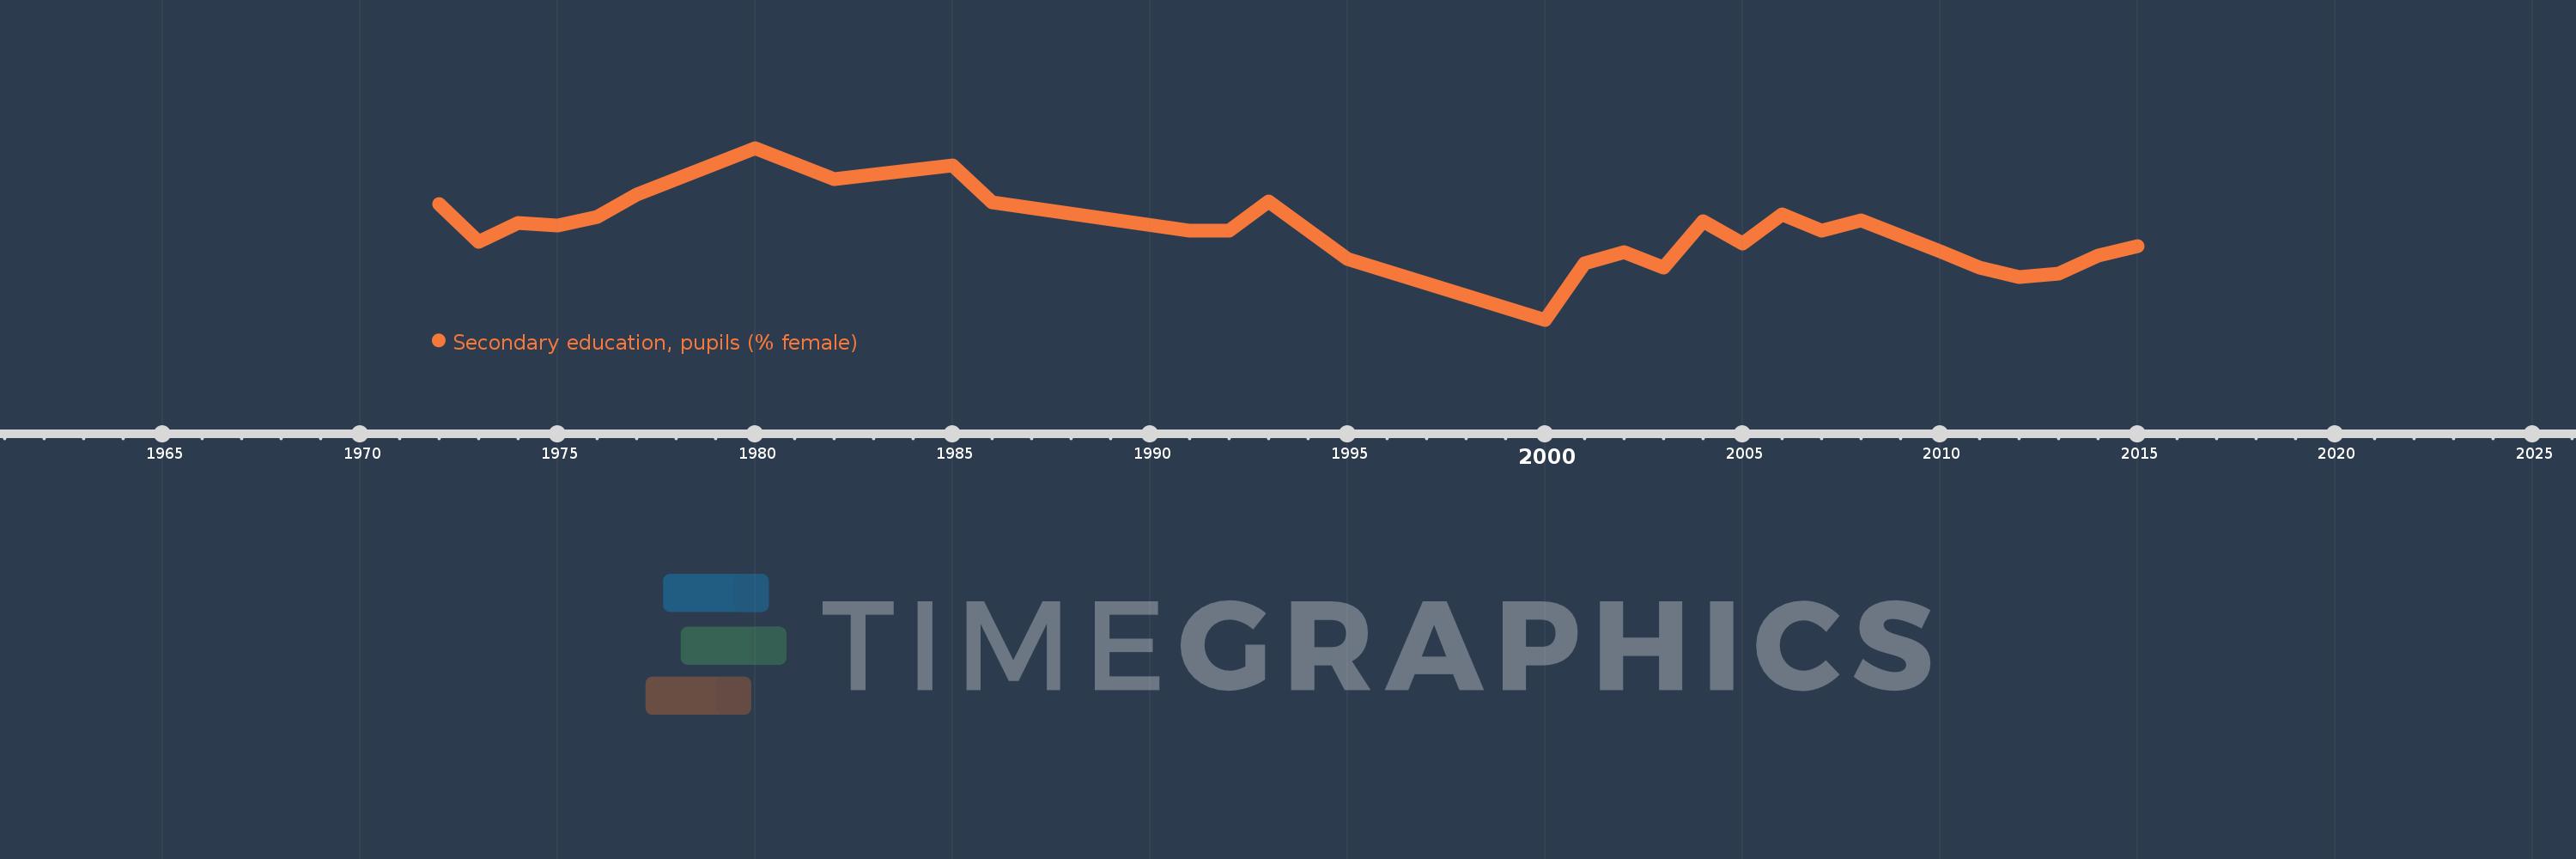
Secondary education, pupils (% female)
2015,2014,2013,2012,2011,2010,2008,2007,2006,2005,2004,2003,2002,2001,2000,1995,1993,1992,1991,1986,1985,1982,1980,1977,1976,1975,1974,1973,1972