Download This statistics in other country:
Timeline:
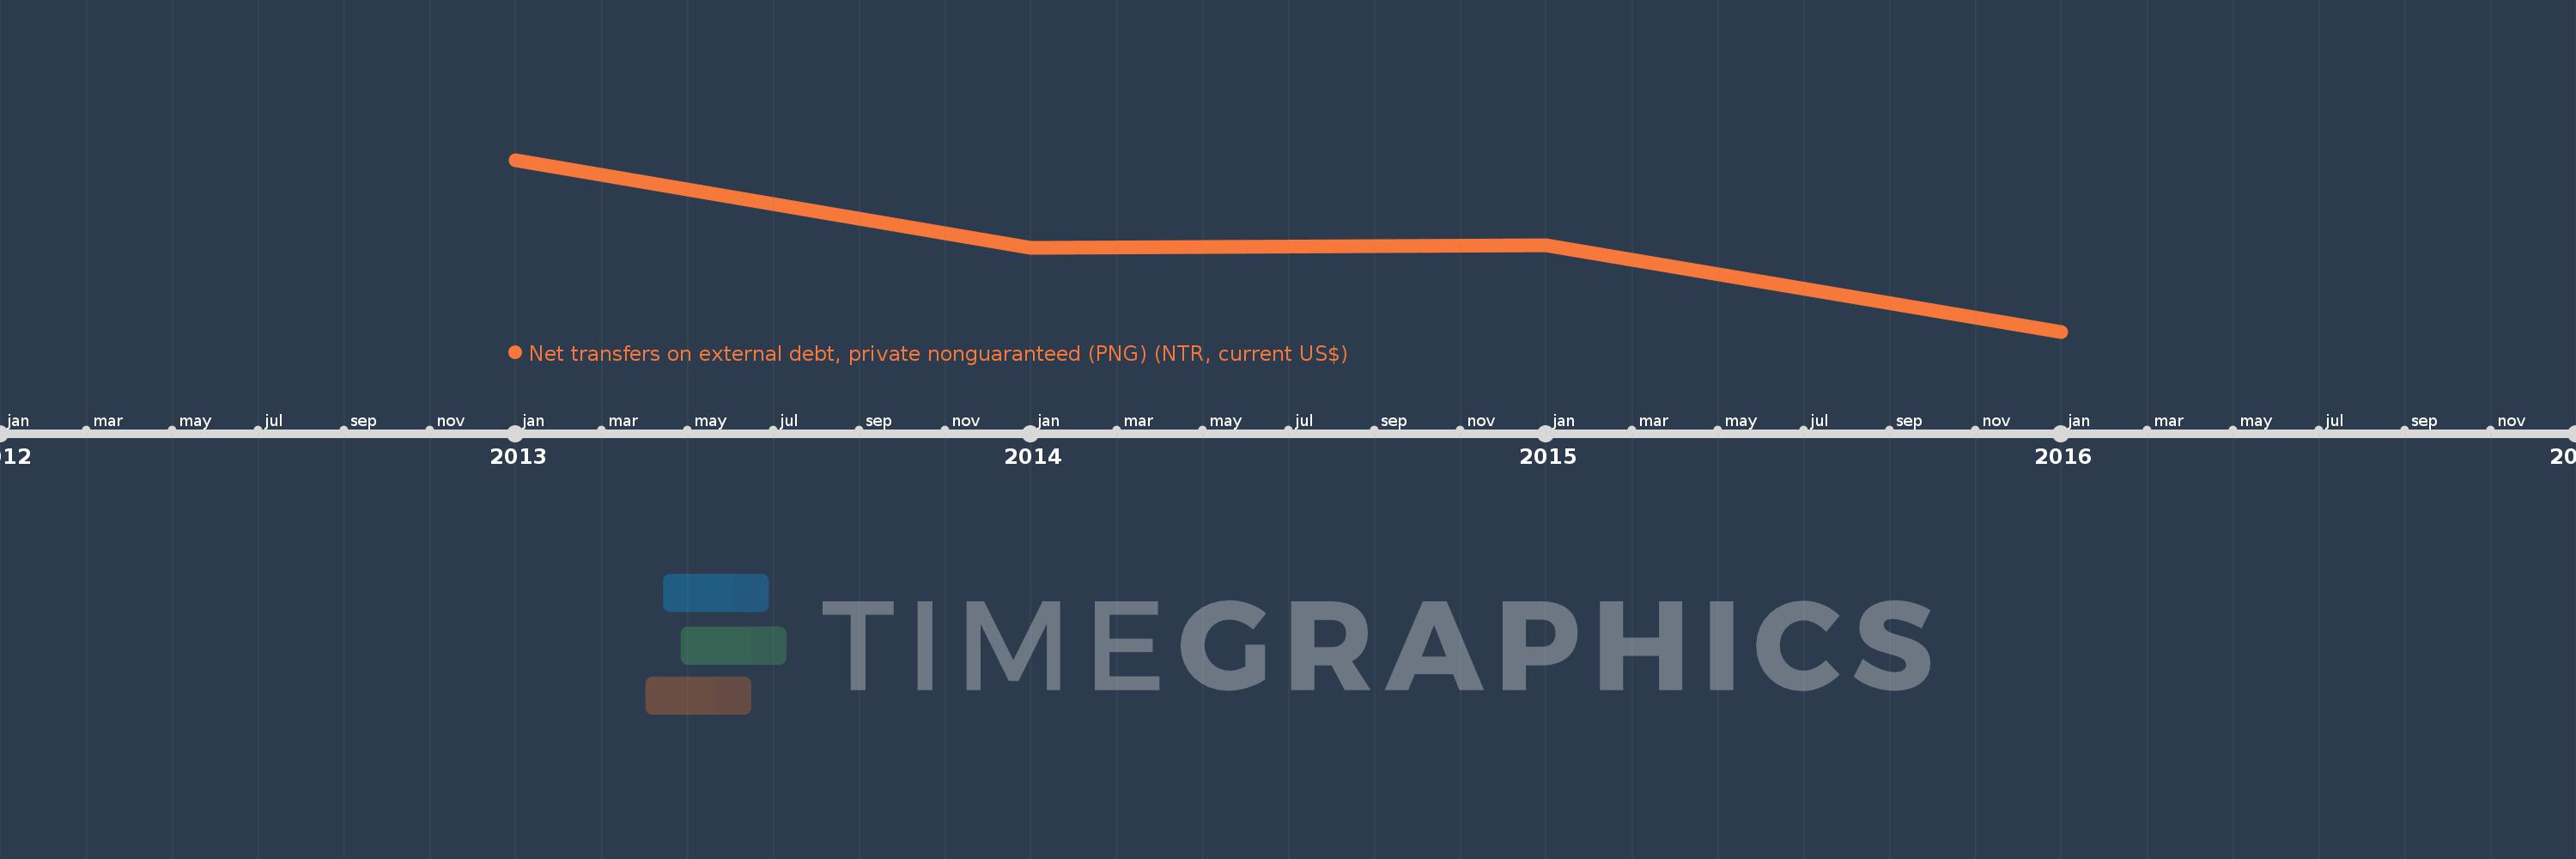
This timeline shows a graph from 2013 to 2016 of Botswana. No data until 2012. Number of actual observations by date: 4.
Source name:
World Development Indicators
Source organization:
World Bank, International Debt Statistics.
Categories, topics:
External Debt
Last updated:
apr 23, 2017
Indicators value changes by year
Minimum:
-84.295 mln
jan 1, 2016
Maximum:
79.689 mln
jan 1, 2013
At the date of observation
Value
Absolute change
Change from the previous value
jan 1, 2013
79.689 mln
+79.689 mln
0.0%
jan 1, 2014
-4.607 mln
-84.296 mln
-105.78%
jan 1, 2015
-2.286 mln
+2.321 mln
-50.38%
jan 1, 2016
-84.295 mln
-82.009 mln
3.59K%
Ranking of countries by current statistics by years