33
/
AIzaSyB4mHJ5NPEv-XzF7P6NDYXjlkCWaeKw5bc
November 1, 2025
89030
Bosnia and Herzegovina
BIH
true
2
1
PNG, commercial banks and other creditors (TDS, current US$)
2016,2015,2014,2013,2012,2011,2010,2009,2008,2007,2006,2005,2004,2003,2002,2001,2000
Create a timeline
Public Timelines
For education
For educational institutions
For teachers
For students
Cabinet
For educational institutions
For teachers
For students
Open cabinet
FAQ
Get premium
Close
Create a timeline
Public timelines
FAQ
About & Feedback
Terms
Privacy
FAQ
Support 24/7
Cabinet
Get premium
Donate
Download
Global statistics library
→
Bosnia and Herzegovina
→
PNG, commercial banks and other creditors (TDS, current US$)
This statistics in other country:
Albania
Algeria
Argentina
Armenia
Azerbaijan
Bangladesh
Belarus
Belize
Bhutan
Bolivia
Bosnia and Herzegovina
Brazil
Bulgaria
Cambodia
Cameroon
China
Colombia
Costa Rica
Cote d'Ivoire
Dominican Republic
East Asia & Pacific (excluding high income)
Ecuador
Egypt, Arab Rep.
El Salvador
Europe & Central Asia (excluding high income)
Fiji
Georgia
Ghana
Guatemala
Guyana
Haiti
Honduras
IDA only
India
Indonesia
Jamaica
Jordan
Kazakhstan
Kenya
Kosovo
Kyrgyz Republic
Lao PDR
Latin America & Caribbean (excluding high income)
Liberia
Low & middle income
Low income
Lower middle income
Macedonia, FYR
Madagascar
Malawi
Malaysia
Maldives
Mauritius
Mexico
Middle East & North Africa (excluding high income)
Middle income
Moldova
Mongolia
Montenegro
Morocco
Myanmar
Nicaragua
Niger
Nigeria
Pakistan
Panama
Papua New Guinea
Paraguay
Peru
Philippines
Romania
Russian Federation
Senegal
Serbia
Solomon Islands
South Africa
South Asia
Sri Lanka
Sub-Saharan Africa (excluding high income)
Tajikistan
Tanzania
Thailand
Tunisia
Turkey
Turkmenistan
Ukraine
Upper middle income
Uzbekistan
Venezuela, RB
Vietnam
Zambia
Zimbabwe
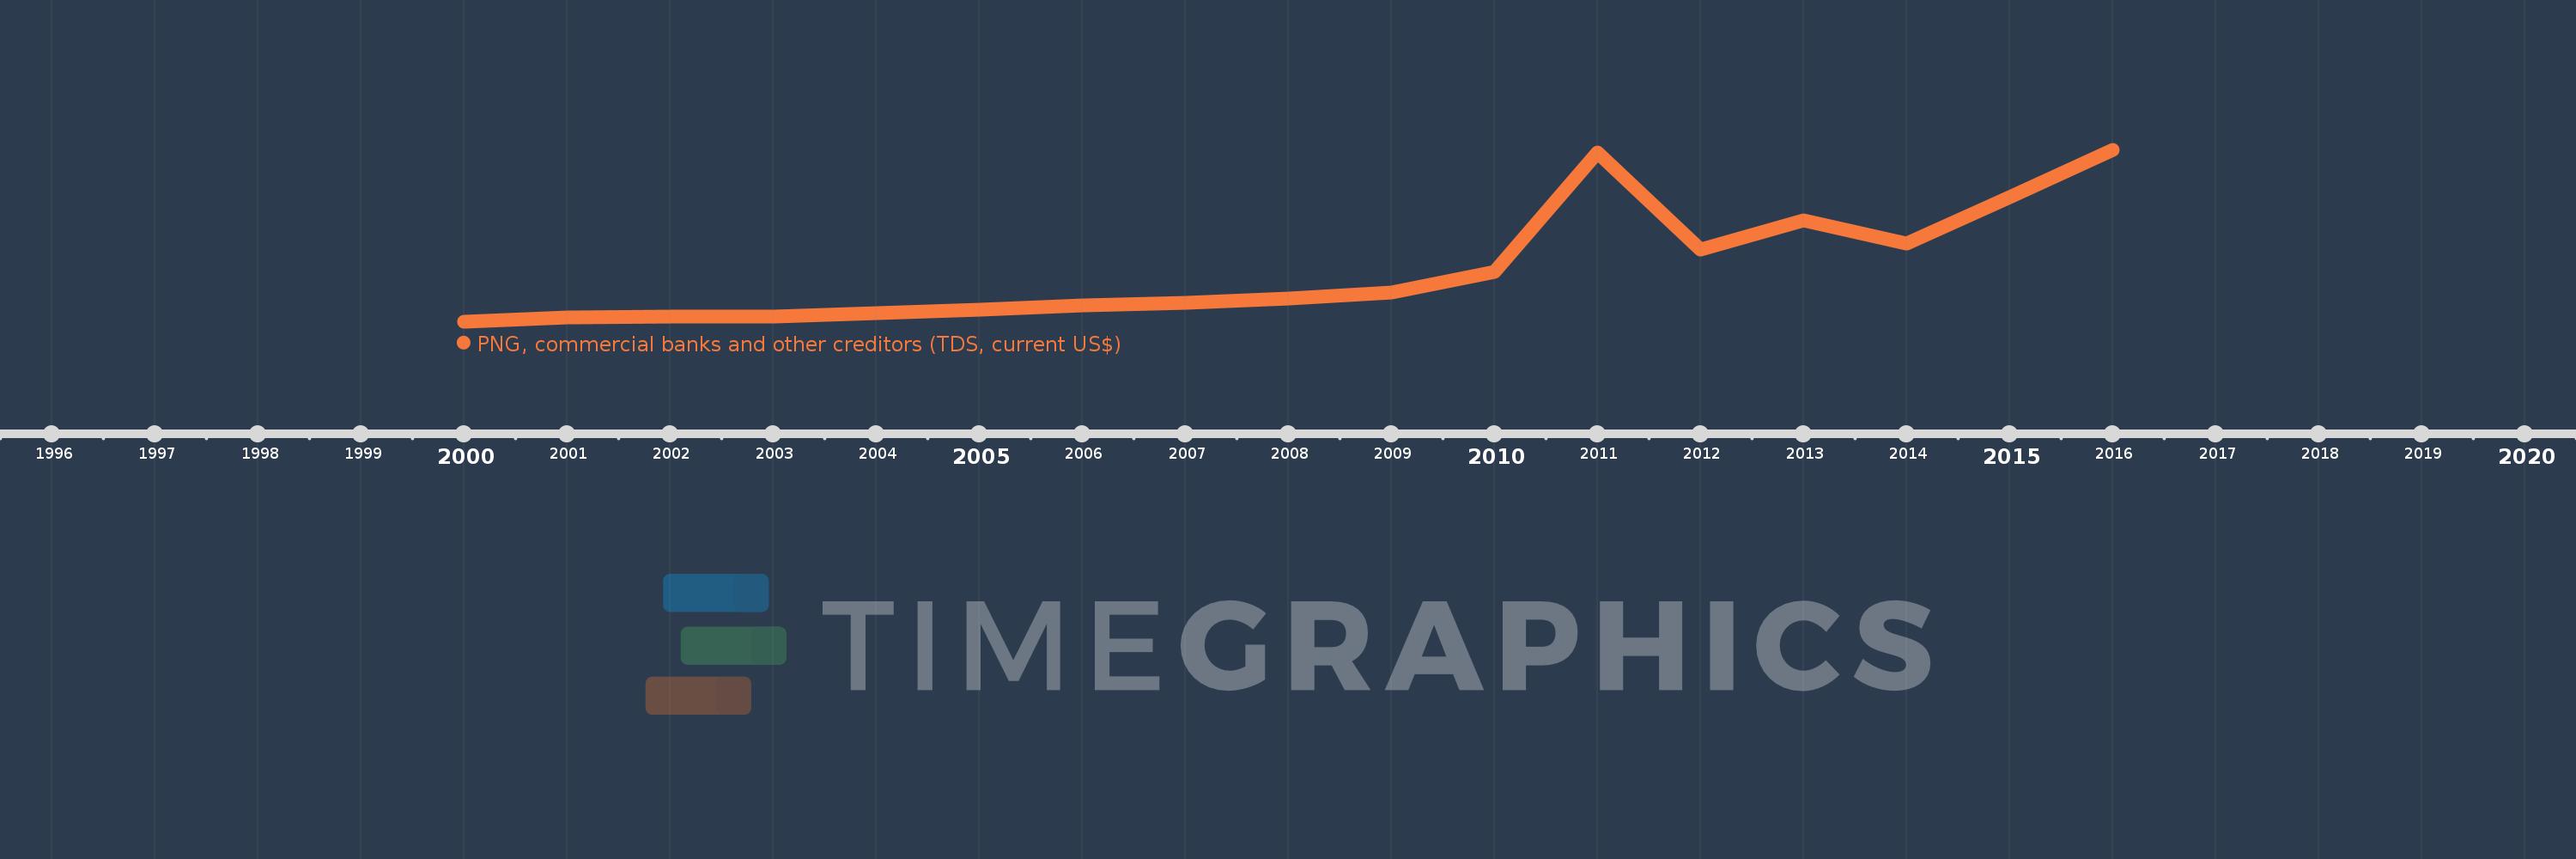
Timeline:
This timeline shows a graph from
2000
to
2016
of Bosnia and Herzegovina. No data until
1999
. Number of actual observations by date:
17
.
Source name:
World Development Indicators
Source organization:
World Bank, International Debt Statistics.
Categories, topics:
External Debt
Last updated:
apr 23, 2017
Indicators value changes by year
Meaning:
393.978 mln
Minimum:
160.0K
jan 1, 2000
Maximum:
1.288 bln
jan 1, 2016
At the date of observation
Value
Absolute change
Change from the previous value
jan 1, 2000
160.0K
+160.0K
0.0%
jan 1, 2001
31.395 mln
+31.235 mln
19.52K%
jan 1, 2002
40.092 mln
+8.697 mln
27.7%
jan 1, 2003
41.291 mln
+1.199 mln
2.99%
jan 1, 2004
64.112 mln
+22.821 mln
55.27%
jan 1, 2005
95.168 mln
+31.056 mln
48.44%
jan 1, 2006
123.524 mln
+28.356 mln
29.8%
jan 1, 2007
146.406 mln
+22.882 mln
18.52%
jan 1, 2008
177.201 mln
+30.795 mln
21.03%
jan 1, 2009
222.215 mln
+45.014 mln
25.4%
jan 1, 2010
372.924 mln
+150.709 mln
67.82%
jan 1, 2011
1.269 bln
+895.909 mln
240.24%
jan 1, 2012
542.872 mln
-725.961 mln
-57.21%
jan 1, 2013
760.035 mln
+217.163 mln
40.0%
jan 1, 2014
588.155 mln
-171.88 mln
-22.61%
jan 1, 2015
935.083 mln
+346.928 mln
58.99%
jan 1, 2016
1.288 bln
+353.085 mln
37.76%
Ranking of countries by current statistics by years
About & Feedback
Terms
Privacy
FAQ
Support 24/7
Cabinet
Get premium
Donate
The service accepts bank transfer (ACH, Wire) or cards (Visa, MasterCard, etc). Processed by Stripe.
Secured with SSL