33
/
AIzaSyB4mHJ5NPEv-XzF7P6NDYXjlkCWaeKw5bc
November 30, 2025
88904
Bosnia and Herzegovina
BIH
true
2
1
Net financial flows, IBRD (NFL, current US$)
2016,2015,2014,2013,2012,2011,2010,2009,2008,2007,2006,2005,2004,2003,2002,2001,2000,1997
Create a timeline
Public Timelines
For education
For educational institutions
For teachers
For students
Cabinet
For educational institutions
For teachers
For students
Open cabinet
FAQ
Close
Create a timeline
Public timelines
FAQ
About & Feedback
Terms
Privacy
FAQ
Support 24/7
Cabinet
Get premium
Donate
Download
Global statistics library
→
Bosnia and Herzegovina
→
Net financial flows, IBRD (NFL, current US$)
This statistics in other country:
Albania
Algeria
Angola
Argentina
Armenia
Azerbaijan
Bangladesh
Belarus
Belize
Bolivia
Bosnia and Herzegovina
Botswana
Brazil
Bulgaria
Burundi
Cabo Verde
Cameroon
Caribbean small states
Central Europe and the Baltics
Chad
China
Colombia
Congo, Dem. Rep.
Congo, Rep.
Costa Rica
Cote d'Ivoire
Croatia
Czech Republic
Dominica
Dominican Republic
Early-demographic dividend
East Asia & Pacific
East Asia & Pacific (excluding high income)
East Asia & Pacific (IDA & IBRD countries)
Ecuador
Egypt, Arab Rep.
El Salvador
Equatorial Guinea
Estonia
Ethiopia
Europe & Central Asia
Europe & Central Asia (excluding high income)
Europe & Central Asia (IDA & IBRD countries)
Fiji
Fragile and conflict affected situations
Gabon
Georgia
Ghana
Greece
Grenada
Guatemala
Guinea
Guyana
Honduras
Hungary
IBRD only
IDA & IBRD total
IDA blend
IDA only
IDA total
India
Indonesia
Iran, Islamic Rep.
Jamaica
Jordan
Kazakhstan
Kenya
Korea, Rep.
Kosovo
Late-demographic dividend
Latin America & Caribbean
Latin America & Caribbean (excluding high income)
Latin America & the Caribbean (IDA & IBRD countries)
Lebanon
Lesotho
Liberia
Low & middle income
Low income
Lower middle income
Macedonia, FYR
Madagascar
Malawi
Malaysia
Mauritania
Mauritius
Mexico
Middle East & North Africa
Middle East & North Africa (excluding high income)
Middle East & North Africa (IDA & IBRD countries)
Middle income
Moldova
Montenegro
Morocco
Myanmar
Nicaragua
Nigeria
Oman
Other small states
Pacific island small states
Pakistan
Panama
Papua New Guinea
Paraguay
Peru
Philippines
Poland
Pre-demographic dividend
Romania
Russian Federation
Senegal
Serbia
Seychelles
Sierra Leone
Slovak Republic
Slovenia
Small states
South Africa
South Asia
South Asia (IDA & IBRD)
Sri Lanka
St. Kitts and Nevis
St. Lucia
St. Vincent and the Grenadines
Sub-Saharan Africa
Sub-Saharan Africa (excluding high income)
Sub-Saharan Africa (IDA & IBRD countries)
Sudan
Swaziland
Syrian Arab Republic
Tanzania
Thailand
Togo
Trinidad and Tobago
Tunisia
Turkey
Turkmenistan
Uganda
Ukraine
Upper middle income
Uzbekistan
Venezuela, RB
Vietnam
Zambia
Zimbabwe
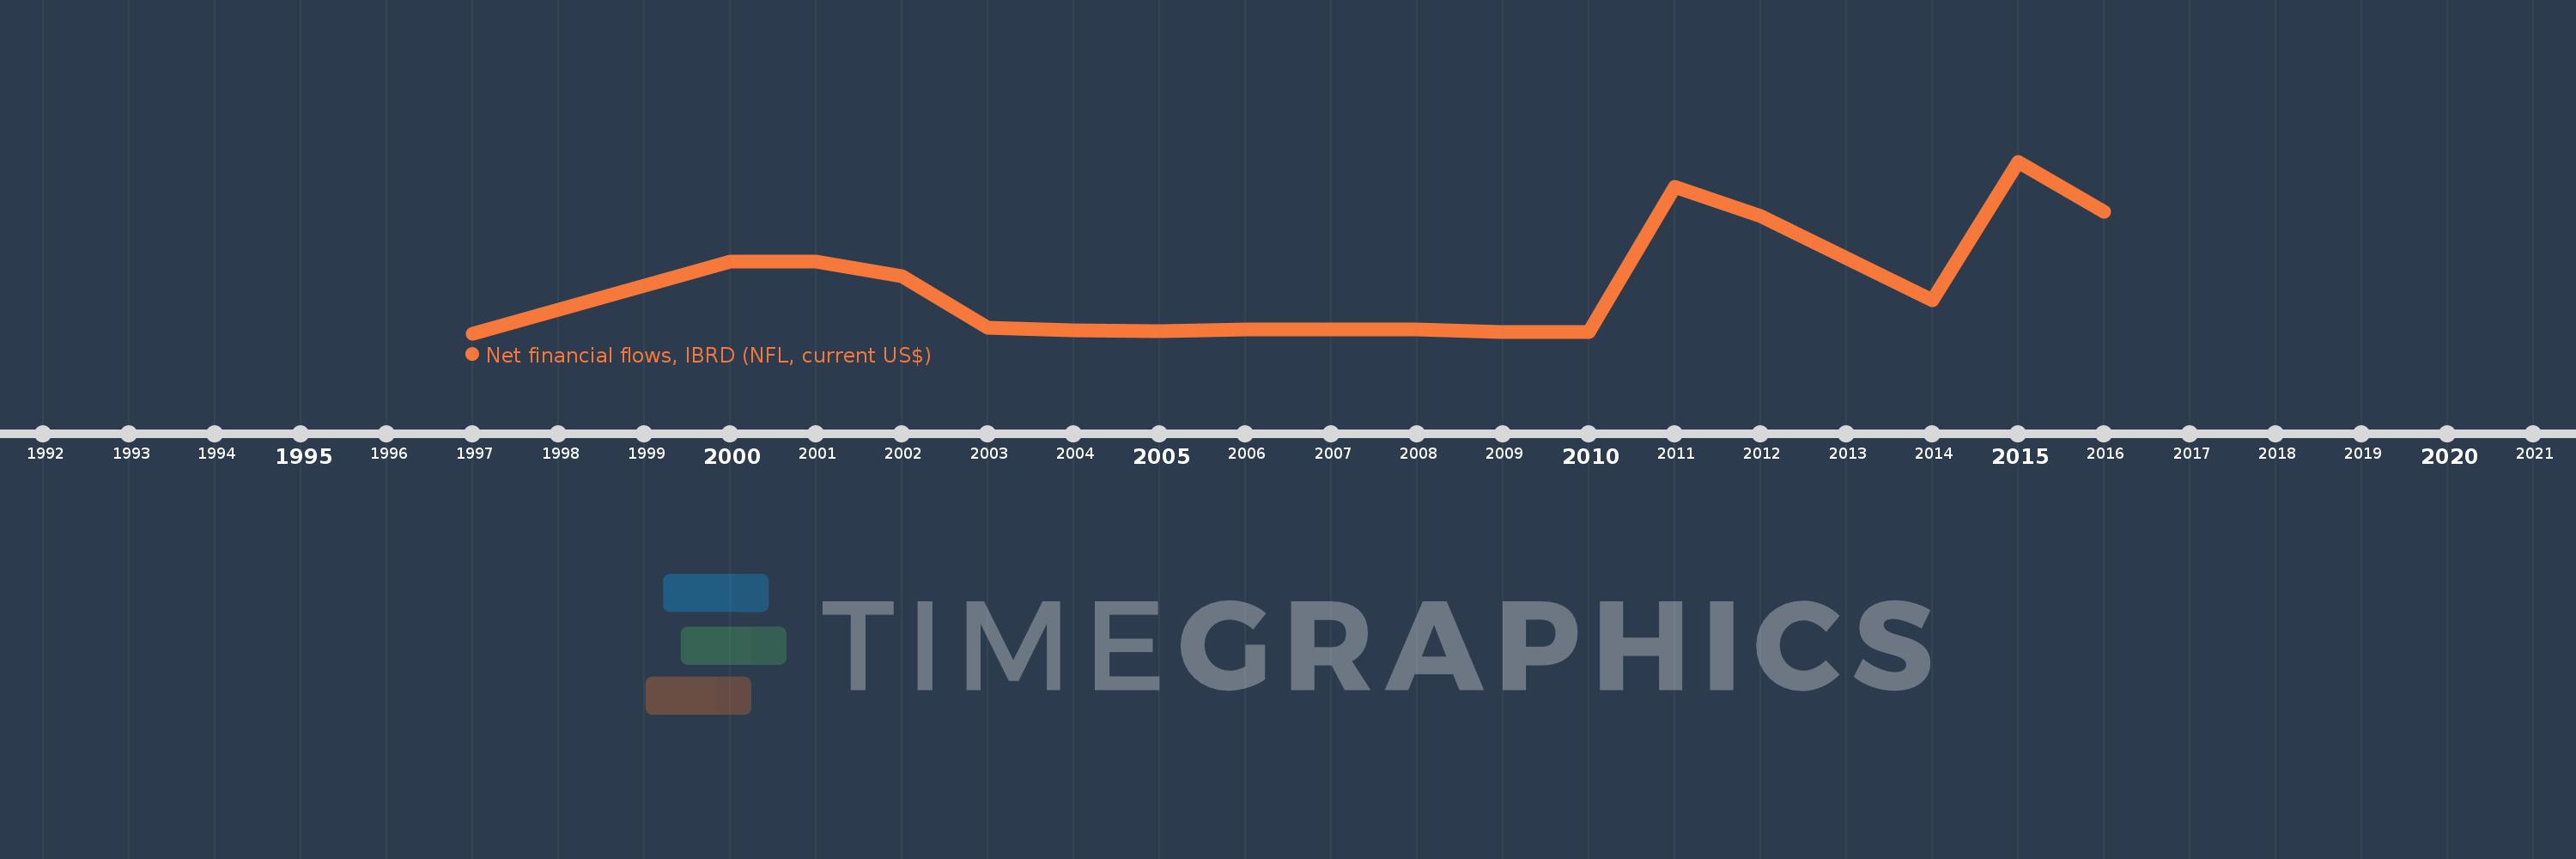
Timeline:
This timeline shows a graph from
1997
to
2016
of Bosnia and Herzegovina. No data until
1996
. Number of actual observations by date:
18
.
Source name:
World Development Indicators
Source organization:
World Bank, International Debt Statistics.
Categories, topics:
External Debt
Last updated:
apr 23, 2017
Indicators value changes by year
Meaning:
-7.871 mln
Minimum:
-25.053 mln
jan 1, 1997
Maximum:
34.668 mln
jan 1, 2015
At the date of observation
Value
Absolute change
Change from the previous value
jan 1, 1997
-25.053 mln
-25.053 mln
0.0%
jan 1, 2000
0.0
+25.053 mln
-100.0%
jan 1, 2001
0.0
0.0
%
jan 1, 2002
-5.327 mln
-5.327 mln
%
jan 1, 2003
-23.107 mln
-17.78 mln
333.77%
jan 1, 2004
-24.097 mln
-990.0K
4.28%
jan 1, 2005
-24.381 mln
-284.0K
1.18%
jan 1, 2006
-23.603 mln
+778.0K
-3.19%
jan 1, 2007
-23.618 mln
-15.0K
0.06%
jan 1, 2008
-23.801 mln
-183.0K
0.77%
jan 1, 2009
-24.63 mln
-829.0K
3.48%
jan 1, 2010
-24.695 mln
-65.0K
0.26%
jan 1, 2011
25.747 mln
+50.442 mln
-204.26%
jan 1, 2012
15.612 mln
-10.135 mln
-39.36%
jan 1, 2013
1.111 mln
-14.501 mln
-92.88%
jan 1, 2014
-13.603 mln
-14.714 mln
-1.32K%
jan 1, 2015
34.668 mln
+48.271 mln
-354.86%
jan 1, 2016
17.105 mln
-17.563 mln
-50.66%
Ranking of countries by current statistics by years
About & Feedback
Terms
Privacy
FAQ
Support 24/7
Cabinet
Get premium
Donate
The service accepts bank transfer (ACH, Wire) or cards (Visa, MasterCard, etc). Processed by Stripe.
Secured with SSL