30
/
AIzaSyAYiBZKx7MnpbEhh9jyipgxe19OcubqV5w
April 1, 2024
87904
Bolivia
BOL
true
2
1
Railways, goods transported (million ton-km)
2009,2006
Download
Global statistics library →Bolivia →

Railways, goods transported (million ton-km)

This statistics in other country:

AlbaniaAlgeriaArab WorldArgentinaArmeniaAustraliaAustriaAzerbaijanBangladeshBelarusBelgiumBeninBoliviaBosnia and HerzegovinaBotswanaBrazilBulgariaBurkina FasoCambodiaCameroonCanadaCentral Europe and the BalticsChileChinaColombiaCongo, Dem. Rep.Congo, Rep.Costa RicaCote d'IvoireCroatiaCubaCzech RepublicDenmarkDjiboutiEarly-demographic dividendEast Asia & PacificEast Asia & Pacific (excluding high income)East Asia & Pacific (IDA & IBRD countries)Egypt, Arab Rep.EstoniaEthiopiaEuro areaEurope & Central AsiaEurope & Central Asia (excluding high income)Europe & Central Asia (IDA & IBRD countries)European UnionFinlandFranceGabonGeorgiaGermanyGhanaGreeceHigh incomeHungaryIBRD onlyIDA & IBRD totalIDA blendIndiaIndonesiaIran, Islamic Rep.IraqIrelandIsraelItalyJapanJordanKazakhstanKenyaKorea, Rep.Kyrgyz RepublicLate-demographic dividendLatviaLithuaniaLow & middle incomeLower middle incomeLuxembourgMacedonia, FYRMadagascarMalawiMalaysiaMaliMauritaniaMexicoMiddle East & North AfricaMiddle East & North Africa (excluding high income)Middle East & North Africa (IDA & IBRD countries)Middle incomeMoldovaMongoliaMoroccoMozambiqueMyanmarNamibiaNetherlandsNew ZealandNigeriaNorth AmericaNorwayOECD membersPakistanPeruPhilippinesPolandPortugalPost-demographic dividendRomaniaRussian FederationSaudi ArabiaSenegalSerbiaSlovak RepublicSloveniaSouth AfricaSouth AsiaSouth Asia (IDA & IBRD)SpainSri LankaSudanSwazilandSwedenSwitzerlandSyrian Arab RepublicTajikistanTanzaniaThailandTunisiaTurkeyTurkmenistanUgandaUkraineUnited KingdomUnited StatesUpper middle incomeUruguayUzbekistanVenezuela, RBVietnamWorldZambiaZimbabwe

Timeline:

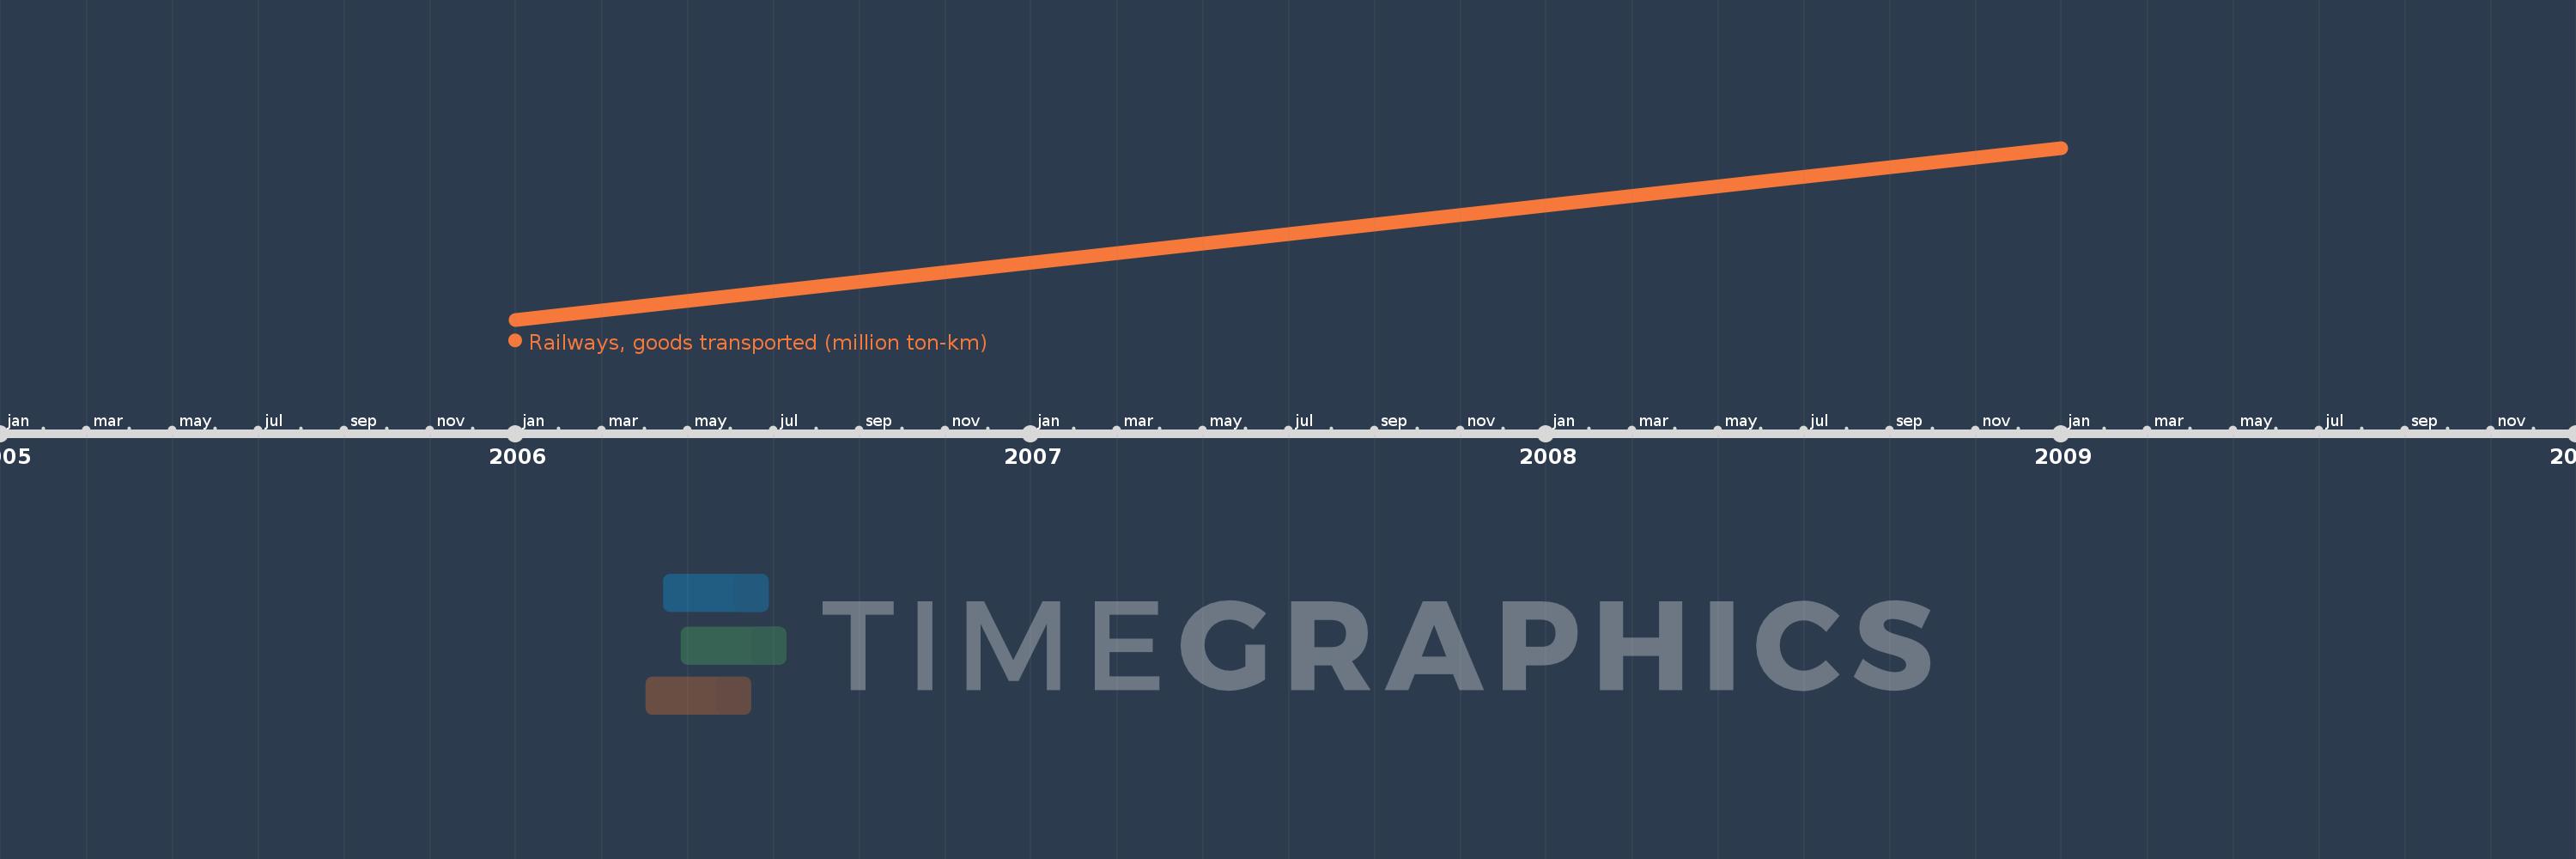
This timeline shows a graph from 2006 to 2009 of Bolivia. No data until 2005. Number of actual observations by date: 2.

Source name:

World Development Indicators

Source organization:

World Bank, Transportation, Water, and Information and Communications Technologies Department, Transport Division.

Categories, topics:

Infrastructure

Last updated:

apr 23, 2017

Indicators value changes by year

Meaning:
1.058K
Minimum:
1.057K
jan 1, 2006
Maximum:
1.06K
jan 1, 2009
At the date of observation
Value
Absolute change
Change from the previous value
jan 1, 2006
1.057K
+1.057K
0.0%
jan 1, 2009
1.06K
+3.0
0.28%

Ranking of countries by current statistics by years