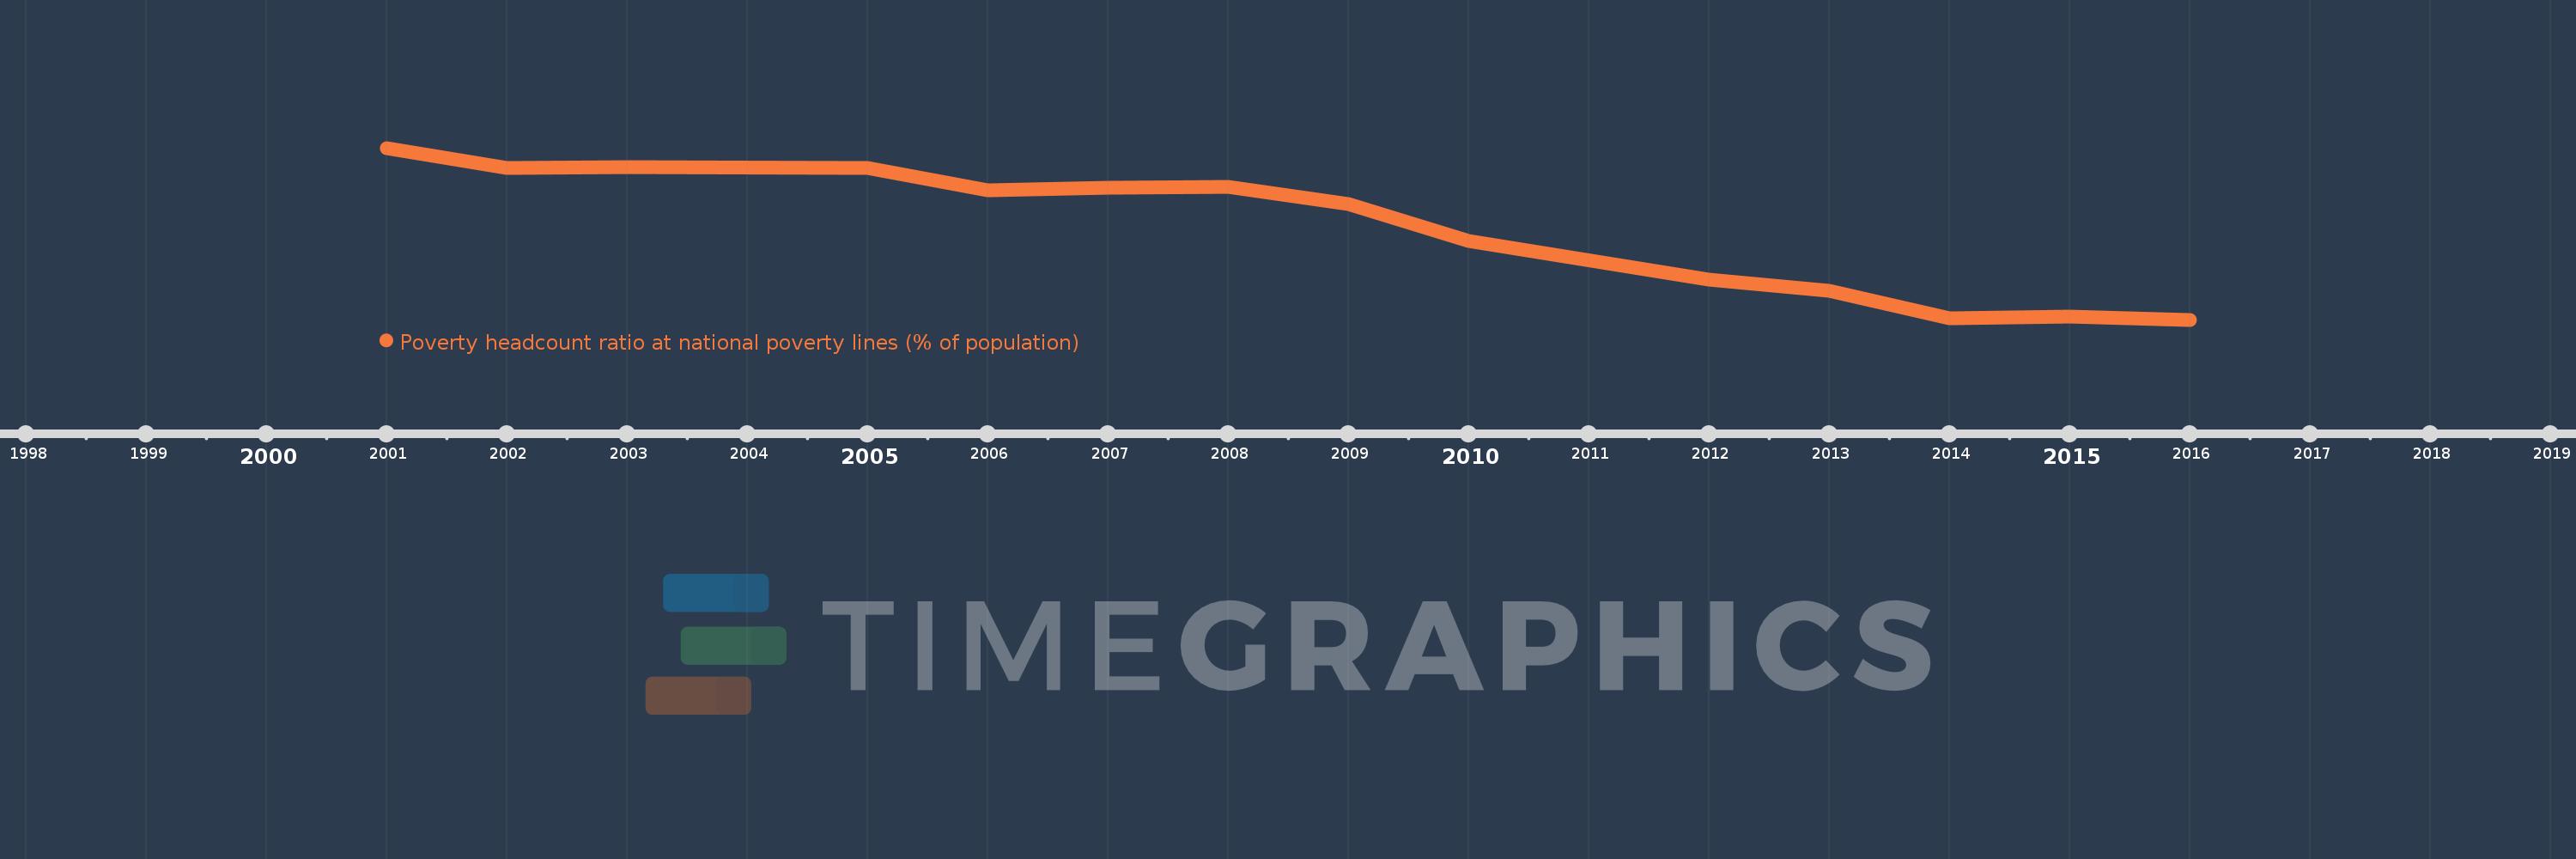
This timeline shows a graph from 2001 to 2016 of Bolivia. No data until 2000. Number of actual observations by date: 14.
Source name:
World Development Indicators
Source organization:
World Bank, Global Poverty Working Group. Data are compiled from official government sources or are computed by World Bank staff using national (i.e. country–specific) poverty lines.
Categories, topics:
Poverty
Last updated:
apr 23, 2017
Indicators value changes by year
Meaning:
53.507
Minimum:
38.6
jan 1, 2016
Maximum:
66.4
jan 1, 2001
At the date of observation
Value
Absolute change
Change from the previous value
jan 1, 2001
66.4
+66.4
0.0%
jan 1, 2002
63.1
-3.3
-4.97%
jan 1, 2003
63.3
+0.2
0.32%
jan 1, 2005
63.1
-0.2
-0.32%
jan 1, 2006
59.6
-3.5
-5.55%
jan 1, 2007
59.9
+0.3
0.5%
jan 1, 2008
60.1
+0.2
0.33%
jan 1, 2009
57.3
-2.8
-4.66%
jan 1, 2010
51.3
-6.0
-10.47%
jan 1, 2012
45.1
-6.2
-12.09%
jan 1, 2013
43.3
-1.8
-3.99%
jan 1, 2014
38.9
-4.4
-10.16%
jan 1, 2015
39.1
+0.2
0.51%
jan 1, 2016
38.6
-0.5
-1.28%
Ranking of countries by current statistics by years