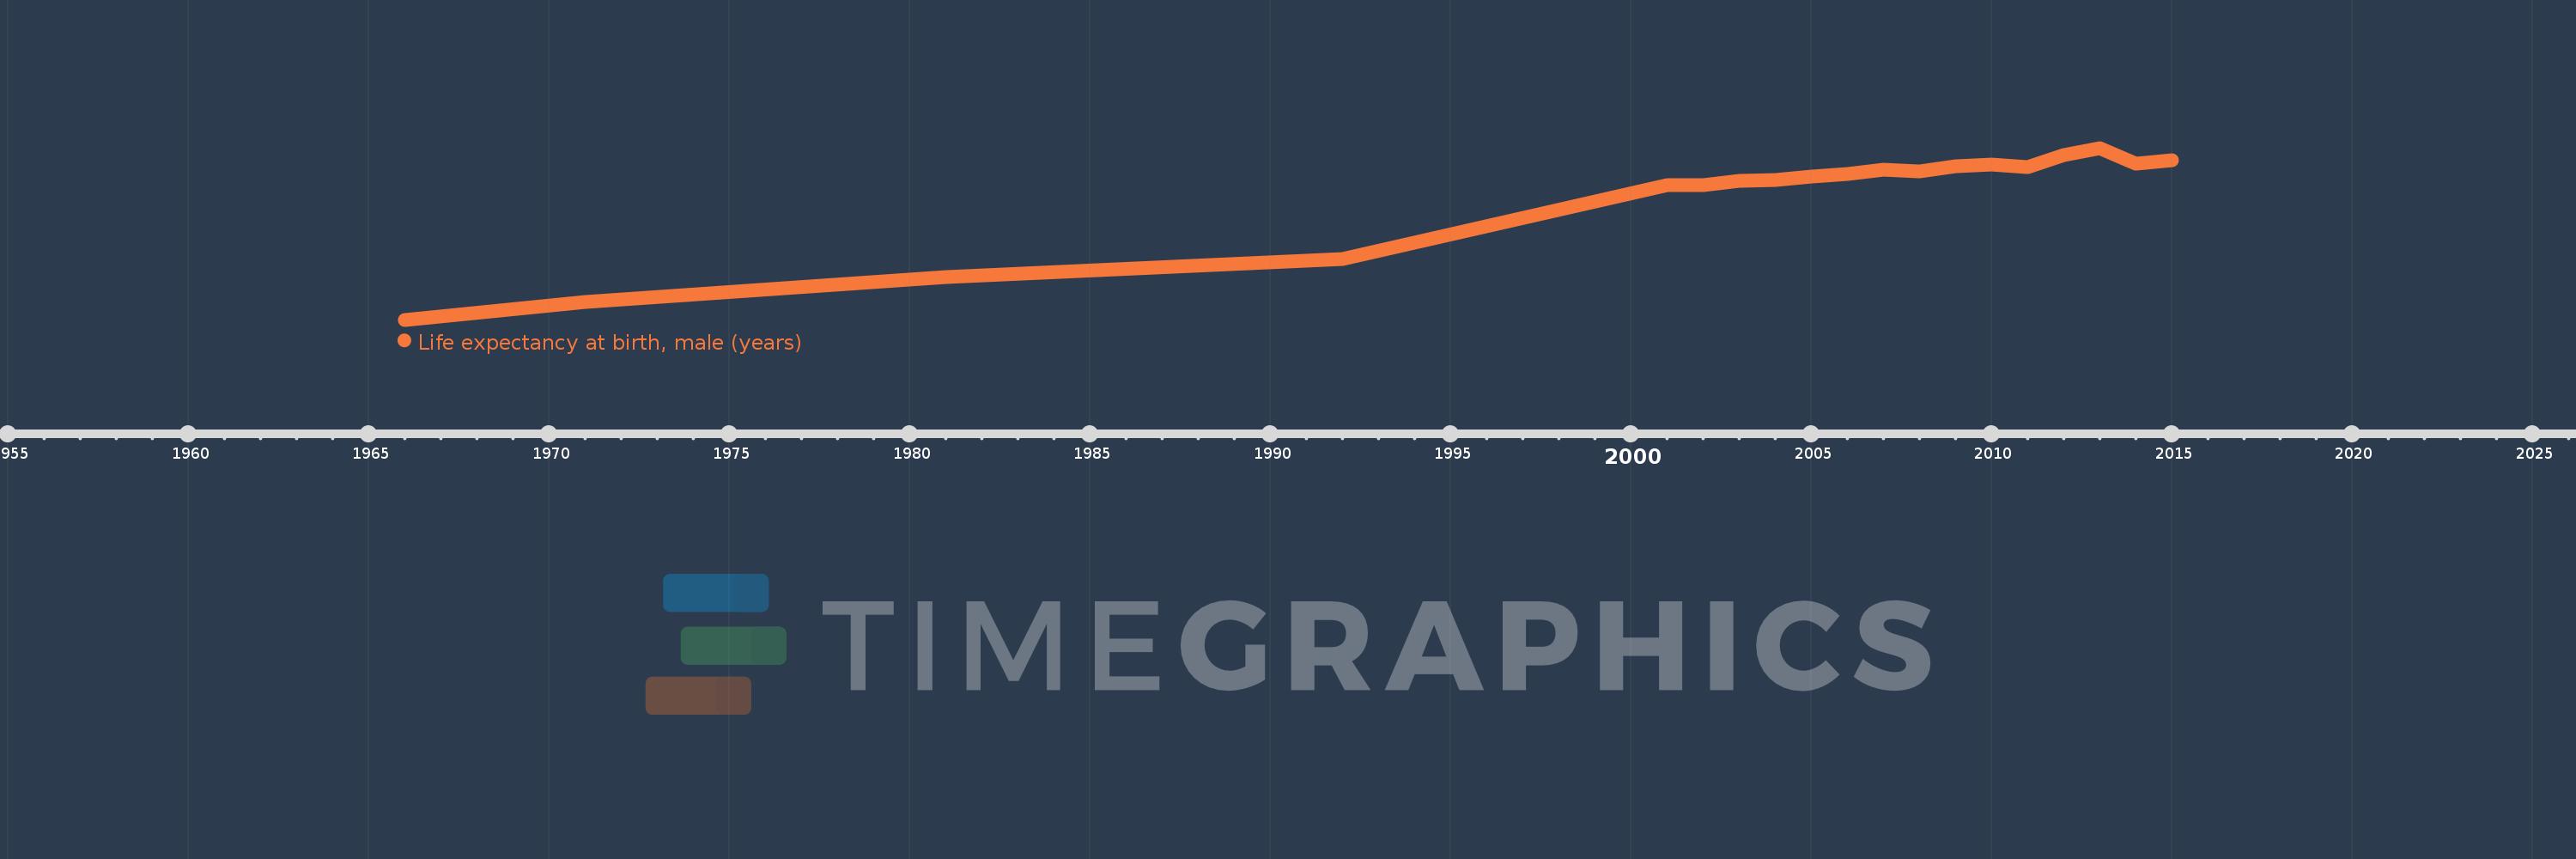
This timeline shows a graph from 1966 to 2015 of Bermuda. No data until 1965. Number of actual observations by date: 19.
Source name:
World Development Indicators
Source organization:
(1) United Nations Population Division. World Population Prospects, (2) Census reports and other statistical publications from national statistical offices, (3) Eurostat: Demographic Statistics, (4) United Nations Statistical Division. Population and Vital Statistics Reprot (various years), (5) U.S. Census Bureau: International Database, and (6) Secretariat of the Pacific Community: Statistics and Demography Programme.
Categories, topics:
Health, Gender, Social Development
Last updated:
apr 23, 2017
Indicators value changes by year
Meaning:
74.597
Minimum:
65.61
jan 1, 1966
Maximum:
77.99
jan 1, 2013
At the date of observation
Value
Absolute change
Change from the previous value
jan 1, 1966
65.61
+65.61
0.0%
jan 1, 1971
66.89
+1.28
1.95%
jan 1, 1981
68.69
+1.8
2.69%
jan 1, 1992
70.01
+1.32
1.92%
jan 1, 2001
75.3
+5.29
7.56%
jan 1, 2002
75.3
0.0
0.0%
jan 1, 2003
75.6
+0.3
0.4%
jan 1, 2004
75.7
+0.1
0.13%
jan 1, 2005
75.9
+0.2
0.26%
jan 1, 2006
76.1
+0.2
0.26%
jan 1, 2007
76.4
+0.3
0.39%
jan 1, 2008
76.3
-0.1
-0.13%
jan 1, 2009
76.7
+0.4
0.52%
jan 1, 2010
76.806
+0.106
0.14%
jan 1, 2011
76.63
-0.176
-0.23%
jan 1, 2012
77.46
+0.83
1.08%
jan 1, 2013
77.99
+0.53
0.68%
jan 1, 2014
76.87
-1.12
-1.44%
jan 1, 2015
77.09
+0.22
0.29%
Ranking of countries by current statistics by years