33
/
AIzaSyB4mHJ5NPEv-XzF7P6NDYXjlkCWaeKw5bc
November 30, 2025
83794
Benin
BEN
true
2
1
Children (0-14) living with HIV
2016,2015,2014,2013,2012,2011,2010,2009,2008,2007,2006,2005,2004,2003,2002,2001,2000,1999,1998,1997,1996,1995,1994,1993,1992,1991
Create a timeline
Public Timelines
For education
For educational institutions
For teachers
For students
Cabinet
For educational institutions
For teachers
For students
Open cabinet
FAQ
Close
Create a timeline
Public timelines
FAQ
About & Feedback
Terms
Privacy
FAQ
Support 24/7
Cabinet
Get premium
Donate
Download
Global statistics library
→
Benin
→
Children (0-14) living with HIV
This statistics in other country:
Afghanistan
Algeria
Angola
Argentina
Australia
Azerbaijan
Bahamas, The
Bangladesh
Belarus
Belize
Benin
Bolivia
Botswana
Brazil
Burkina Faso
Burundi
Cabo Verde
Cameroon
Central African Republic
Chad
Colombia
Congo, Dem. Rep.
Costa Rica
Cote d'Ivoire
Cuba
Djibouti
Dominican Republic
Ecuador
Egypt, Arab Rep.
El Salvador
Equatorial Guinea
Eritrea
Gabon
Gambia, The
Georgia
Ghana
Greece
Guatemala
Guinea
Guyana
Haiti
Honduras
Indonesia
Iran, Islamic Rep.
Italy
Jamaica
Kazakhstan
Kenya
Kyrgyz Republic
Latvia
Lesotho
Liberia
Madagascar
Malawi
Malaysia
Mali
Mauritania
Mexico
Moldova
Mongolia
Morocco
Mozambique
Myanmar
Namibia
Nepal
Nicaragua
Niger
Nigeria
Pakistan
Panama
Papua New Guinea
Paraguay
Peru
Philippines
Rwanda
Senegal
Sierra Leone
Somalia
South Africa
South Sudan
Spain
Sri Lanka
Sudan
Suriname
Swaziland
Tajikistan
Tanzania
Thailand
Togo
Trinidad and Tobago
Uganda
Ukraine
Uruguay
Uzbekistan
Venezuela, RB
Vietnam
World
Yemen, Rep.
Zambia
Zimbabwe
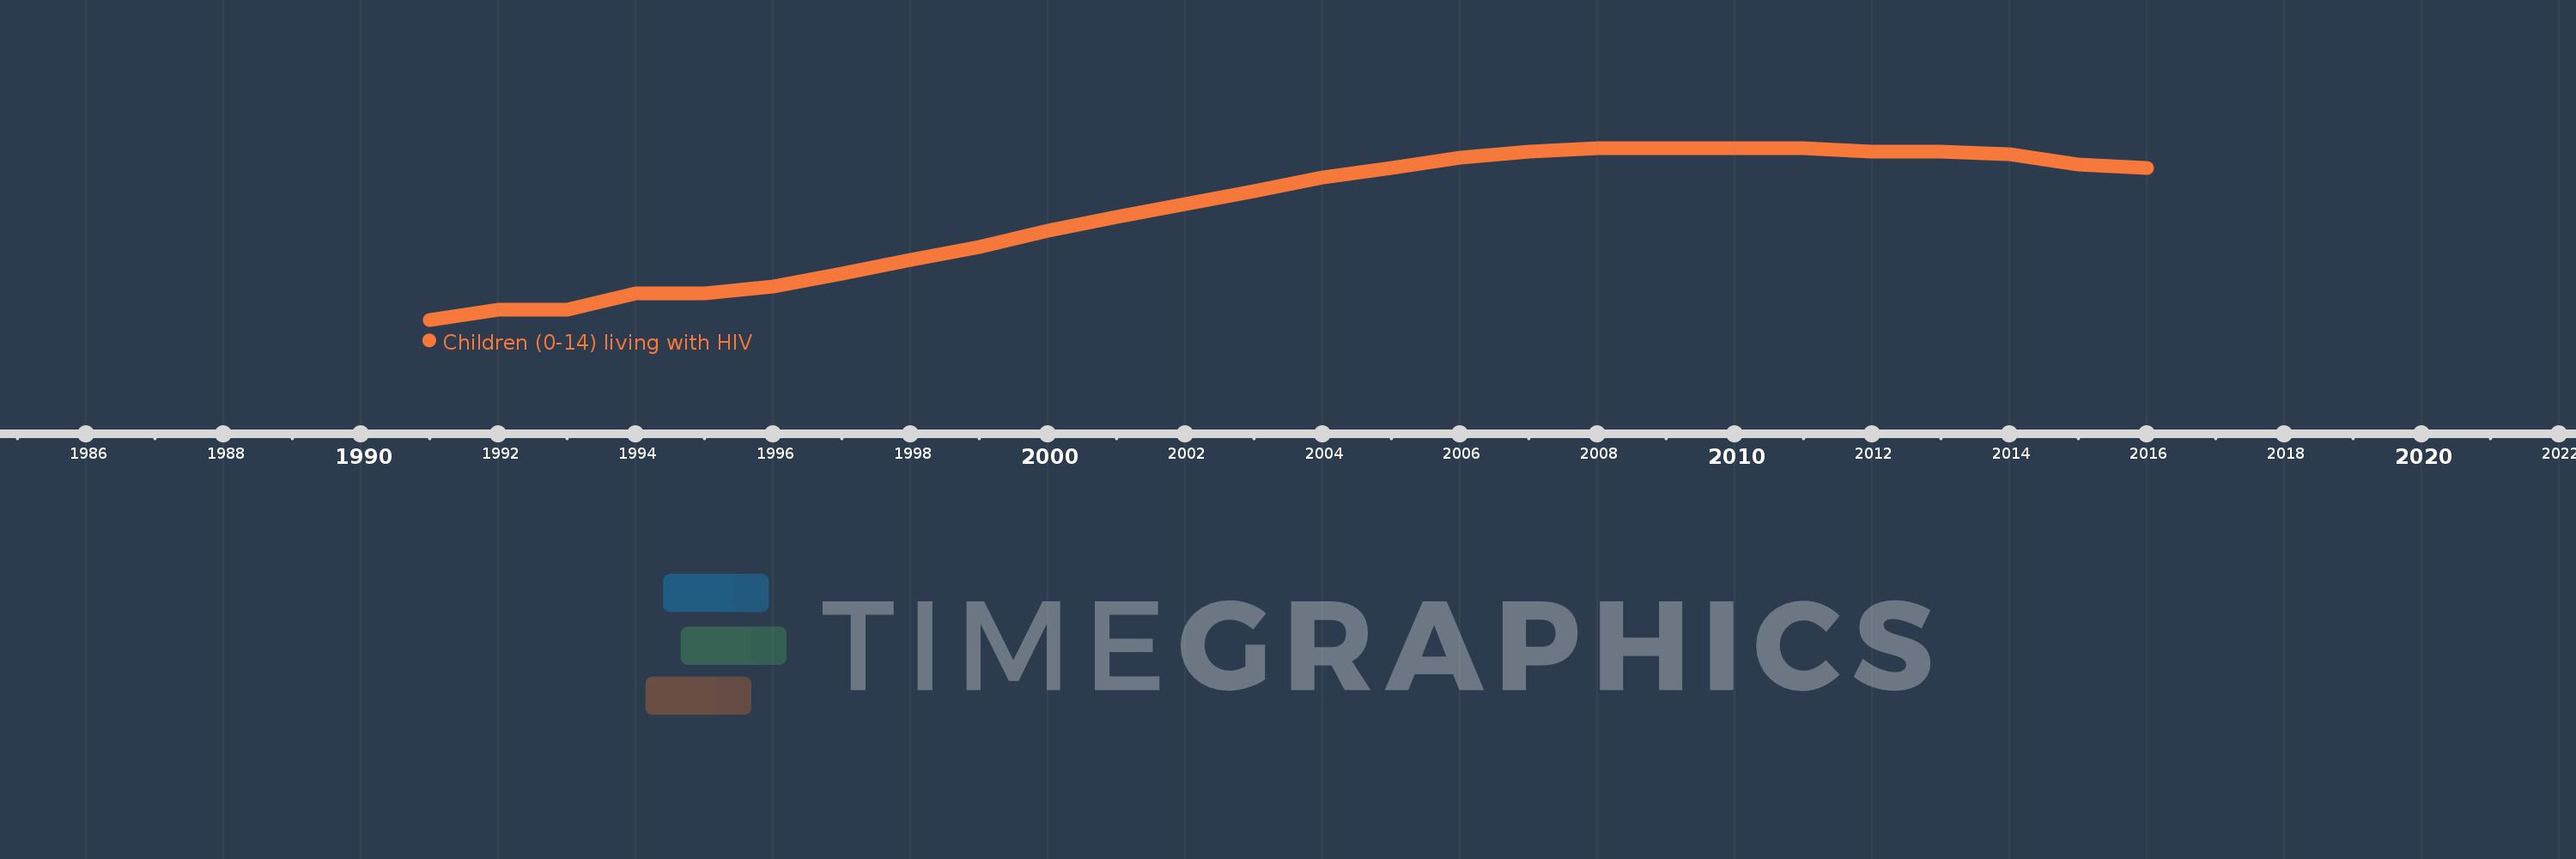
Timeline:
This timeline shows a graph from
1991
to
2016
of Benin. No data until
1990
. Number of actual observations by date:
26
.
Source name:
World Development Indicators
Source organization:
UNAIDS estimates.
Categories, topics:
Health
Last updated:
apr 23, 2017
Indicators value changes by year
Meaning:
3.508K
Minimum:
200.0
jan 1, 1991
Maximum:
5.4K
jan 1, 2008
At the date of observation
Value
Absolute change
Change from the previous value
jan 1, 1991
200.0
+200.0
0.0%
jan 1, 1992
500.0
+300.0
150.0%
jan 1, 1993
500.0
0.0
0.0%
jan 1, 1994
1000.0
+500.0
100.0%
jan 1, 1995
1000.0
0.0
0.0%
jan 1, 1996
1.2K
+200.0
20.0%
jan 1, 1997
1.6K
+400.0
33.33%
jan 1, 1998
2.0K
+400.0
25.0%
jan 1, 1999
2.4K
+400.0
20.0%
jan 1, 2000
2.9K
+500.0
20.83%
jan 1, 2001
3.3K
+400.0
13.79%
jan 1, 2002
3.7K
+400.0
12.12%
jan 1, 2003
4.1K
+400.0
10.81%
jan 1, 2004
4.5K
+400.0
9.76%
jan 1, 2005
4.8K
+300.0
6.67%
jan 1, 2006
5.1K
+300.0
6.25%
jan 1, 2007
5.3K
+200.0
3.92%
jan 1, 2008
5.4K
+100.0
1.89%
jan 1, 2009
5.4K
0.0
0.0%
jan 1, 2010
5.4K
0.0
0.0%
jan 1, 2011
5.4K
0.0
0.0%
jan 1, 2012
5.3K
-100.0
-1.85%
jan 1, 2013
5.3K
0.0
0.0%
jan 1, 2014
5.2K
-100.0
-1.89%
jan 1, 2015
4.9K
-300.0
-5.77%
jan 1, 2016
4.8K
-100.0
-2.04%
Ranking of countries by current statistics by years
About & Feedback
Terms
Privacy
FAQ
Support 24/7
Cabinet
Get premium
Donate
The service accepts bank transfer (ACH, Wire) or cards (Visa, MasterCard, etc). Processed by Stripe.
Secured with SSL