Download This statistics in other country:
Timeline:
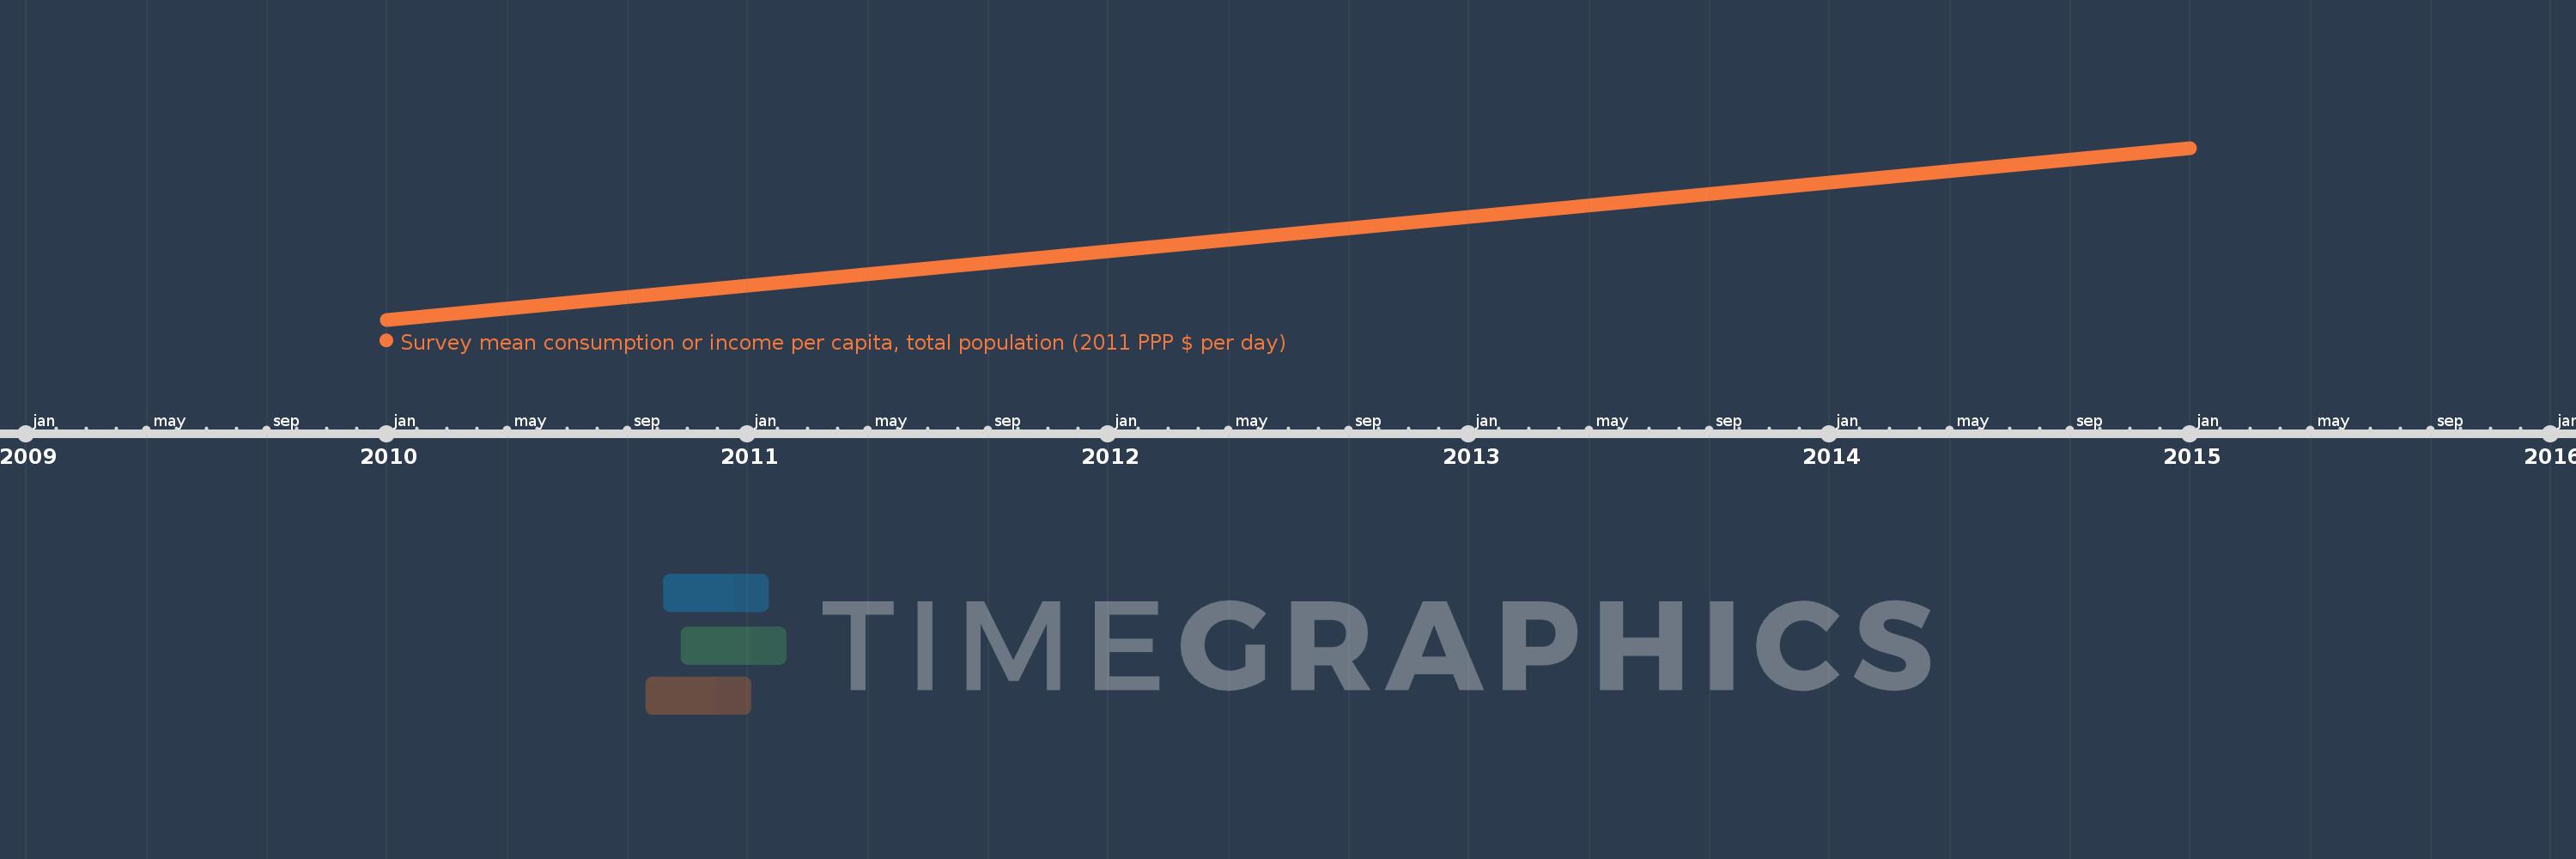
This timeline shows a graph from 2010 to 2015 of Belarus. No data until 2009. Number of actual observations by date: 2.
Source name:
World Development Indicators
Source organization:
World Bank, Global Database of Shared Prosperity (GDSP) circa 2008 - 2013 (http://www.worldbank.org/en/topic/poverty/brief/global-database-of-shared-prosperity).
Categories, topics:
Poverty
Last updated:
apr 23, 2017
Indicators value changes by year
At the date of observation
Value
Absolute change
Change from the previous value
jan 1, 2010
13.16
+13.16
0.0%
jan 1, 2015
19.48
+6.32
48.02%
Ranking of countries by current statistics by years