33
/
AIzaSyB4mHJ5NPEv-XzF7P6NDYXjlkCWaeKw5bc
November 30, 2025
81027
Belarus
BLR
true
2
1
PNG, commercial banks and other creditors (DIS, current US$)
2016,2015,2014,2013,2012,2011,2010,2009,2008,2007,2006,2005,2004,2003,2002,2001
Create a timeline
Public Timelines
For education
For educational institutions
For teachers
For students
Cabinet
For educational institutions
For teachers
For students
Open cabinet
FAQ
Close
Create a timeline
Public timelines
FAQ
About & Feedback
Terms
Privacy
FAQ
Support 24/7
Cabinet
Get premium
Donate
Download
Global statistics library
→
Belarus
→
PNG, commercial banks and other creditors (DIS, current US$)
This statistics in other country:
Albania
Algeria
Argentina
Armenia
Azerbaijan
Bangladesh
Belarus
Belize
Bhutan
Bolivia
Bosnia and Herzegovina
Brazil
Bulgaria
Cambodia
Cameroon
China
Colombia
Costa Rica
Cote d'Ivoire
Dominican Republic
East Asia & Pacific (excluding high income)
Ecuador
Egypt, Arab Rep.
El Salvador
Europe & Central Asia (excluding high income)
Fiji
Georgia
Ghana
Guatemala
Guyana
Haiti
Honduras
IDA only
India
Indonesia
Jamaica
Jordan
Kazakhstan
Kenya
Kosovo
Kyrgyz Republic
Lao PDR
Latin America & Caribbean (excluding high income)
Liberia
Low & middle income
Low income
Lower middle income
Macedonia, FYR
Madagascar
Malawi
Malaysia
Maldives
Mauritius
Mexico
Middle East & North Africa (excluding high income)
Middle income
Moldova
Mongolia
Montenegro
Morocco
Myanmar
Nicaragua
Niger
Nigeria
Pakistan
Panama
Papua New Guinea
Paraguay
Peru
Philippines
Romania
Russian Federation
Senegal
Serbia
Solomon Islands
South Africa
South Asia
Sri Lanka
Sub-Saharan Africa (excluding high income)
Tajikistan
Tanzania
Thailand
Tunisia
Turkey
Turkmenistan
Ukraine
Upper middle income
Uzbekistan
Venezuela, RB
Vietnam
Zambia
Zimbabwe
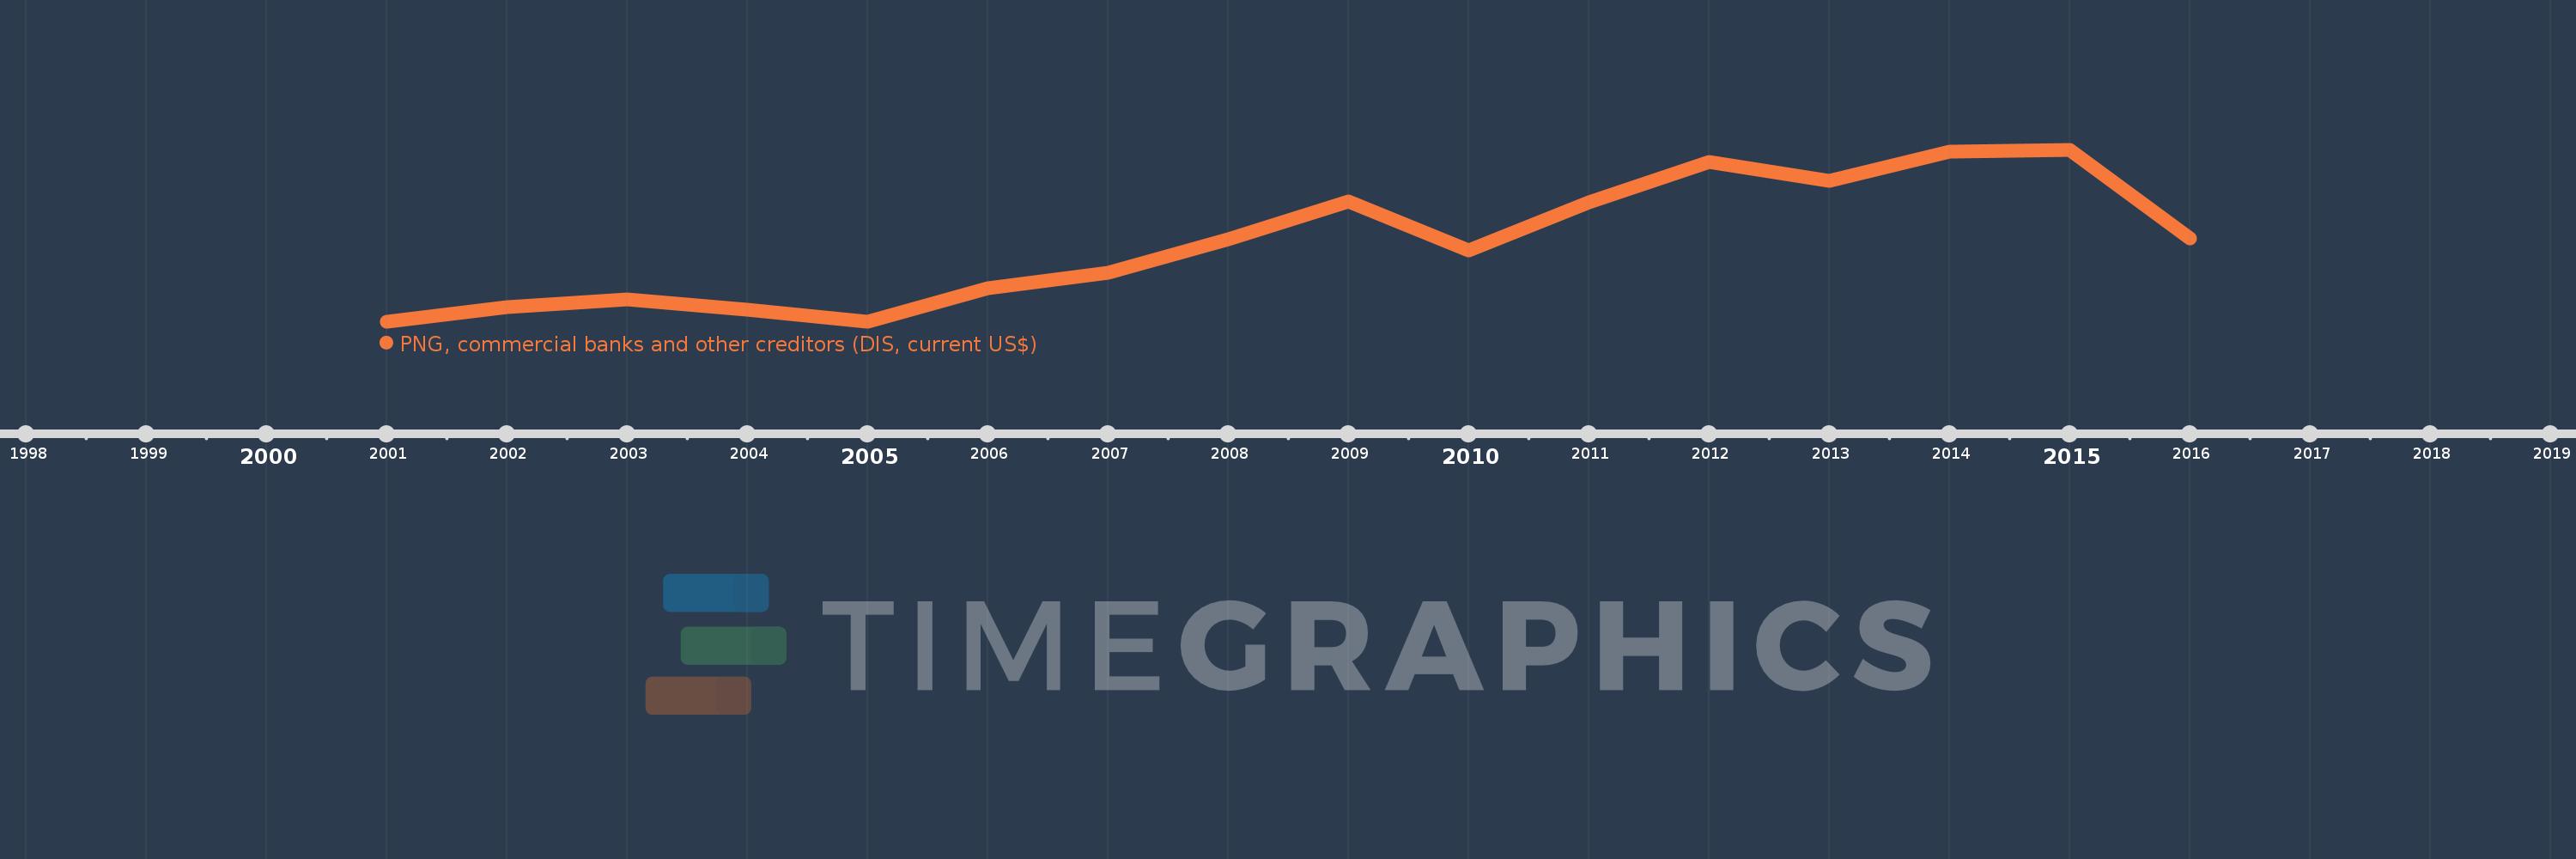
Timeline:
This timeline shows a graph from
2001
to
2016
of Belarus. No data until
2000
. Number of actual observations by date:
16
.
Source name:
World Development Indicators
Source organization:
World Bank, International Debt Statistics.
Categories, topics:
External Debt
Last updated:
apr 23, 2017
Indicators value changes by year
Meaning:
778.903 mln
Minimum:
105.922 mln
jan 1, 2001
Maximum:
1.58 bln
jan 1, 2015
At the date of observation
Value
Absolute change
Change from the previous value
jan 1, 2001
105.922 mln
+105.922 mln
0.0%
jan 1, 2002
234.833 mln
+128.911 mln
121.7%
jan 1, 2003
298.387 mln
+63.554 mln
27.06%
jan 1, 2004
212.119 mln
-86.268 mln
-28.91%
jan 1, 2005
110.817 mln
-101.302 mln
-47.76%
jan 1, 2006
394.53 mln
+283.713 mln
256.02%
jan 1, 2007
527.408 mln
+132.878 mln
33.68%
jan 1, 2008
815.177 mln
+287.769 mln
54.56%
jan 1, 2009
1.141 bln
+326.046 mln
40.0%
jan 1, 2010
720.161 mln
-421.062 mln
-36.9%
jan 1, 2011
1.132 bln
+411.462 mln
57.13%
jan 1, 2012
1.479 bln
+347.677 mln
30.72%
jan 1, 2013
1.32 bln
-159.62 mln
-10.79%
jan 1, 2014
1.567 bln
+246.848 mln
18.71%
jan 1, 2015
1.58 bln
+13.372 mln
0.85%
jan 1, 2016
824.841 mln
-755.059 mln
-47.79%
Ranking of countries by current statistics by years
About & Feedback
Terms
Privacy
FAQ
Support 24/7
Cabinet
Get premium
Donate
The service accepts bank transfer (ACH, Wire) or cards (Visa, MasterCard, etc). Processed by Stripe.
Secured with SSL