33
/
AIzaSyB4mHJ5NPEv-XzF7P6NDYXjlkCWaeKw5bc
November 30, 2025
79121
Bangladesh
BGD
true
2
1
Wanted fertility rate (births per woman)
2012,2008,2005,2001,1998,1995
Create a timeline
Public Timelines
For education
For educational institutions
For teachers
For students
Cabinet
For educational institutions
For teachers
For students
Open cabinet
FAQ
Close
Create a timeline
Public timelines
FAQ
About & Feedback
Terms
Privacy
FAQ
Support 24/7
Cabinet
Get premium
Donate
Download
Global statistics library
→
Bangladesh
→
Wanted fertility rate (births per woman)
This statistics in other country:
Albania
Armenia
Azerbaijan
Bangladesh
Benin
Bolivia
Botswana
Brazil
Burkina Faso
Burundi
Cabo Verde
Cambodia
Cameroon
Central African Republic
Chad
Colombia
Comoros
Congo, Dem. Rep.
Congo, Rep.
Cote d'Ivoire
Dominican Republic
Early-demographic dividend
Ecuador
Egypt, Arab Rep.
El Salvador
Eritrea
Ethiopia
Gabon
Gambia, The
Georgia
Ghana
Guatemala
Guinea
Guyana
Haiti
Heavily indebted poor countries (HIPC)
Honduras
IDA blend
IDA only
IDA total
India
Indonesia
Jamaica
Jordan
Kazakhstan
Kenya
Kyrgyz Republic
Least developed countries: UN classification
Lesotho
Liberia
Low income
Lower middle income
Madagascar
Malawi
Maldives
Mali
Mauritania
Mexico
Moldova
Morocco
Mozambique
Namibia
Nepal
Nicaragua
Niger
Nigeria
Pakistan
Paraguay
Peru
Philippines
Pre-demographic dividend
Romania
Rwanda
Sao Tome and Principe
Senegal
Sierra Leone
South Africa
South Asia
South Asia (IDA & IBRD)
Sri Lanka
Sub-Saharan Africa
Sub-Saharan Africa (excluding high income)
Sub-Saharan Africa (IDA & IBRD countries)
Sudan
Swaziland
Tajikistan
Tanzania
Thailand
Timor-Leste
Togo
Trinidad and Tobago
Tunisia
Turkey
Turkmenistan
Uganda
Ukraine
Uzbekistan
Vietnam
Yemen, Rep.
Zambia
Zimbabwe
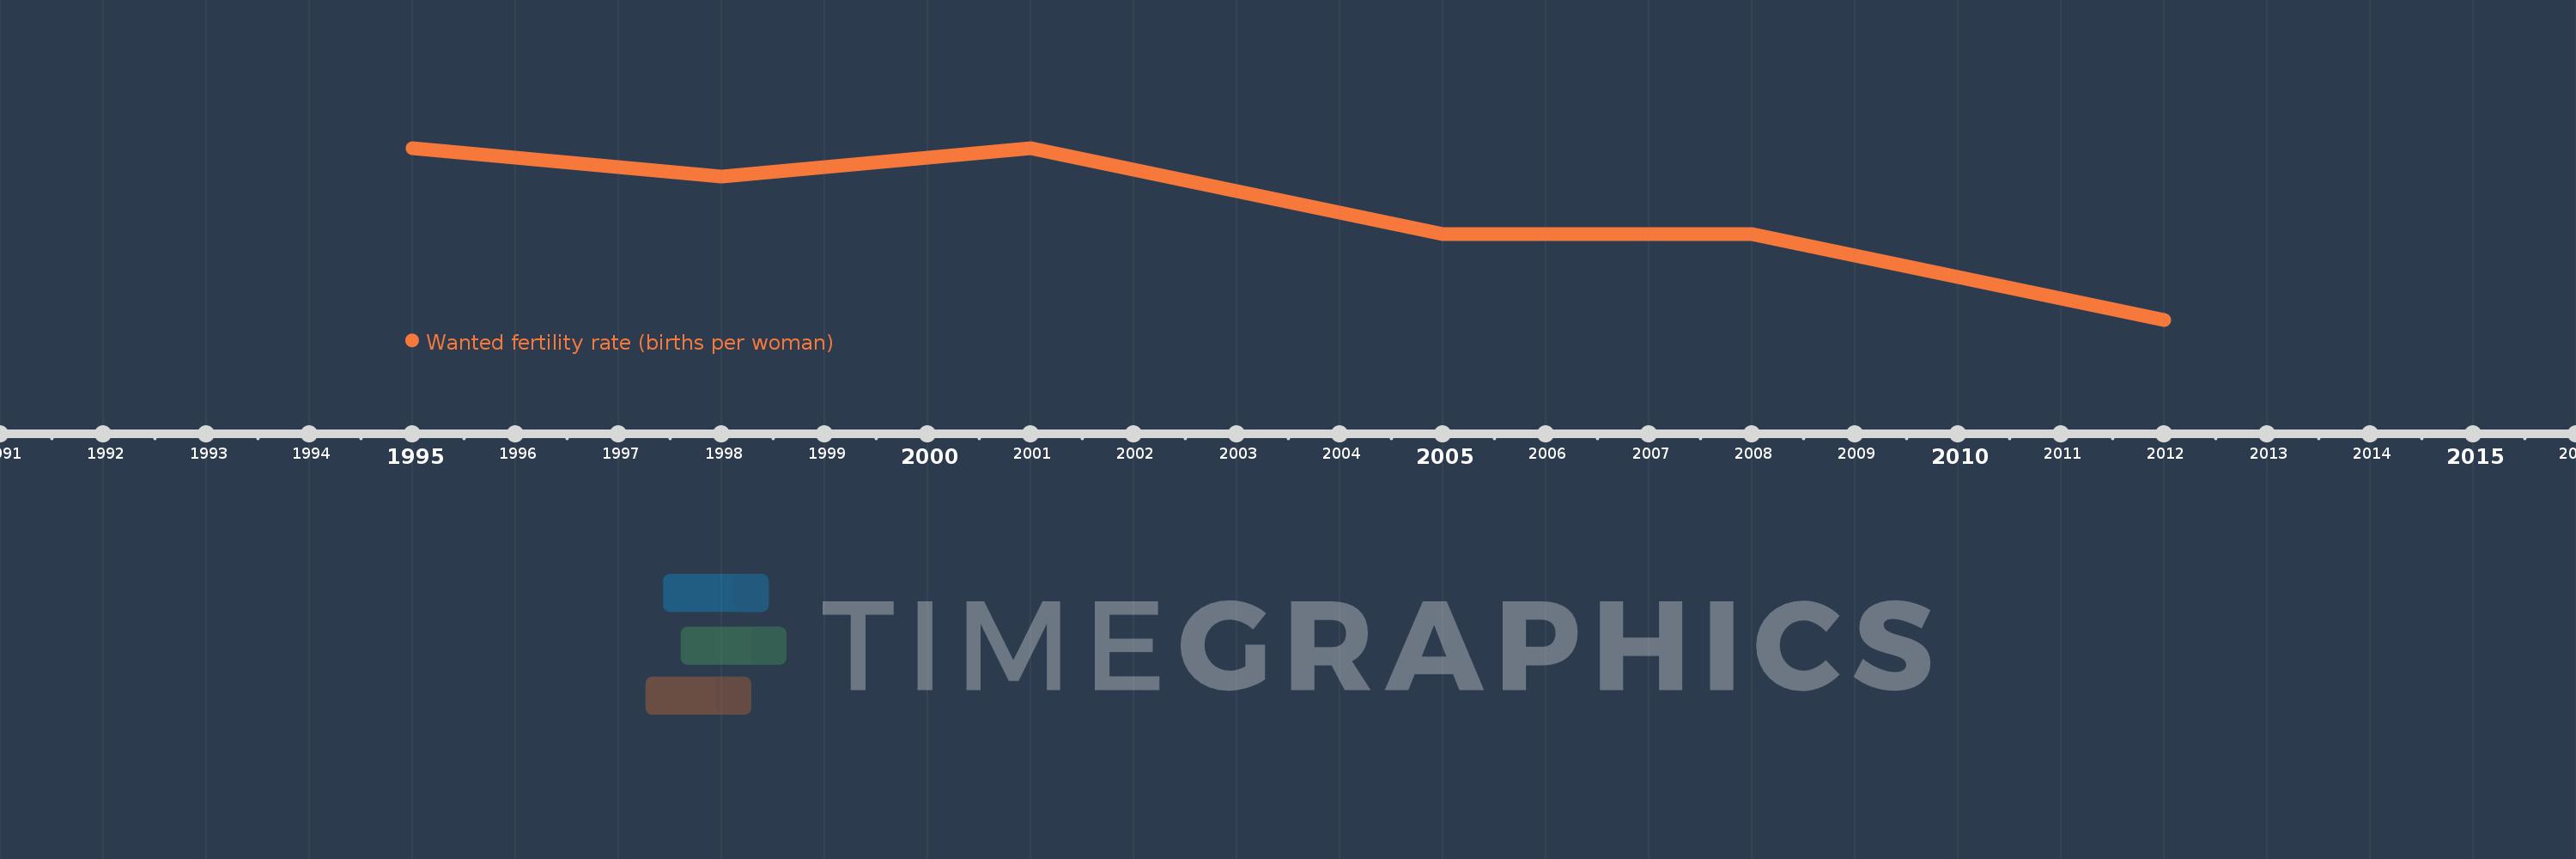
Timeline:
This timeline shows a graph from
1995
to
2012
of Bangladesh. No data until
1994
. Number of actual observations by date:
6
.
Source name:
World Development Indicators
Source organization:
Demographic and Health Surveys.
Categories, topics:
Health, Gender
Last updated:
apr 23, 2017
Indicators value changes by year
Meaning:
1.983
Minimum:
1.6
jan 1, 2012
Maximum:
2.2
jan 1, 1995
At the date of observation
Value
Absolute change
Change from the previous value
jan 1, 1995
2.2
+2.2
0.0%
jan 1, 1998
2.1
-0.1
-4.55%
jan 1, 2001
2.2
+0.1
4.76%
jan 1, 2005
1.9
-0.3
-13.64%
jan 1, 2008
1.9
0.0
0.0%
jan 1, 2012
1.6
-0.3
-15.79%
Ranking of countries by current statistics by years
About & Feedback
Terms
Privacy
FAQ
Support 24/7
Cabinet
Get premium
Donate
The service accepts bank transfer (ACH, Wire) or cards (Visa, MasterCard, etc). Processed by Stripe.
Secured with SSL