Download This statistics in other country:
Timeline:
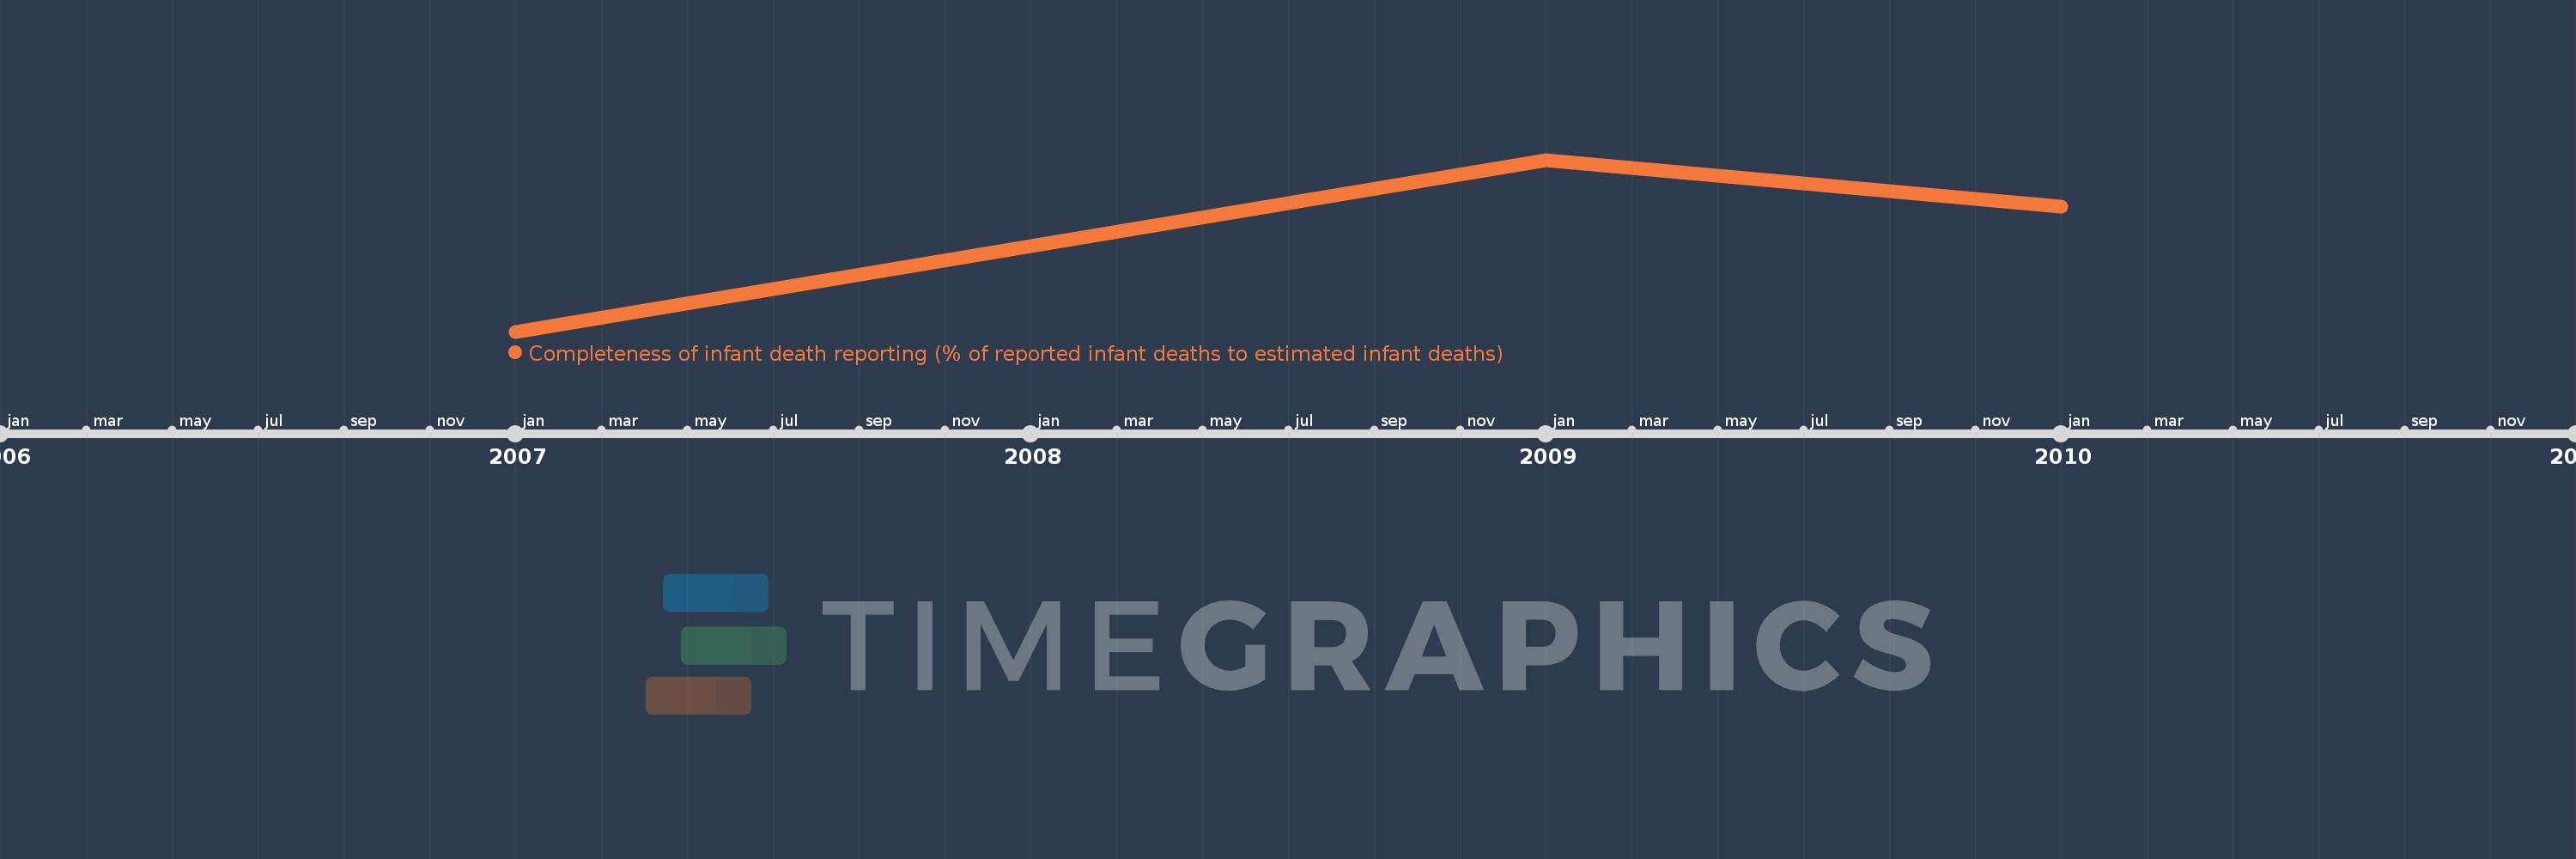
This timeline shows a graph from 2007 to 2010 of Bahrain. No data until 2006. Number of actual observations by date: 3.
Source name:
World Development Indicators
Source organization:
The United Nations Statistics Division's Population and Vital Statistics Report and the United Nations Population Division's World Population Prospects.
Categories, topics:
Health
Last updated:
apr 23, 2017
Indicators value changes by year
Minimum:
80.986
jan 1, 2007
Maximum:
84.667
jan 1, 2009
At the date of observation
Value
Absolute change
Change from the previous value
jan 1, 2007
80.986
+80.986
0.0%
jan 1, 2009
84.667
+3.681
4.54%
jan 1, 2010
83.66
-1.007
-1.19%
Ranking of countries by current statistics by years