33
/
AIzaSyB4mHJ5NPEv-XzF7P6NDYXjlkCWaeKw5bc
November 30, 2025
76914
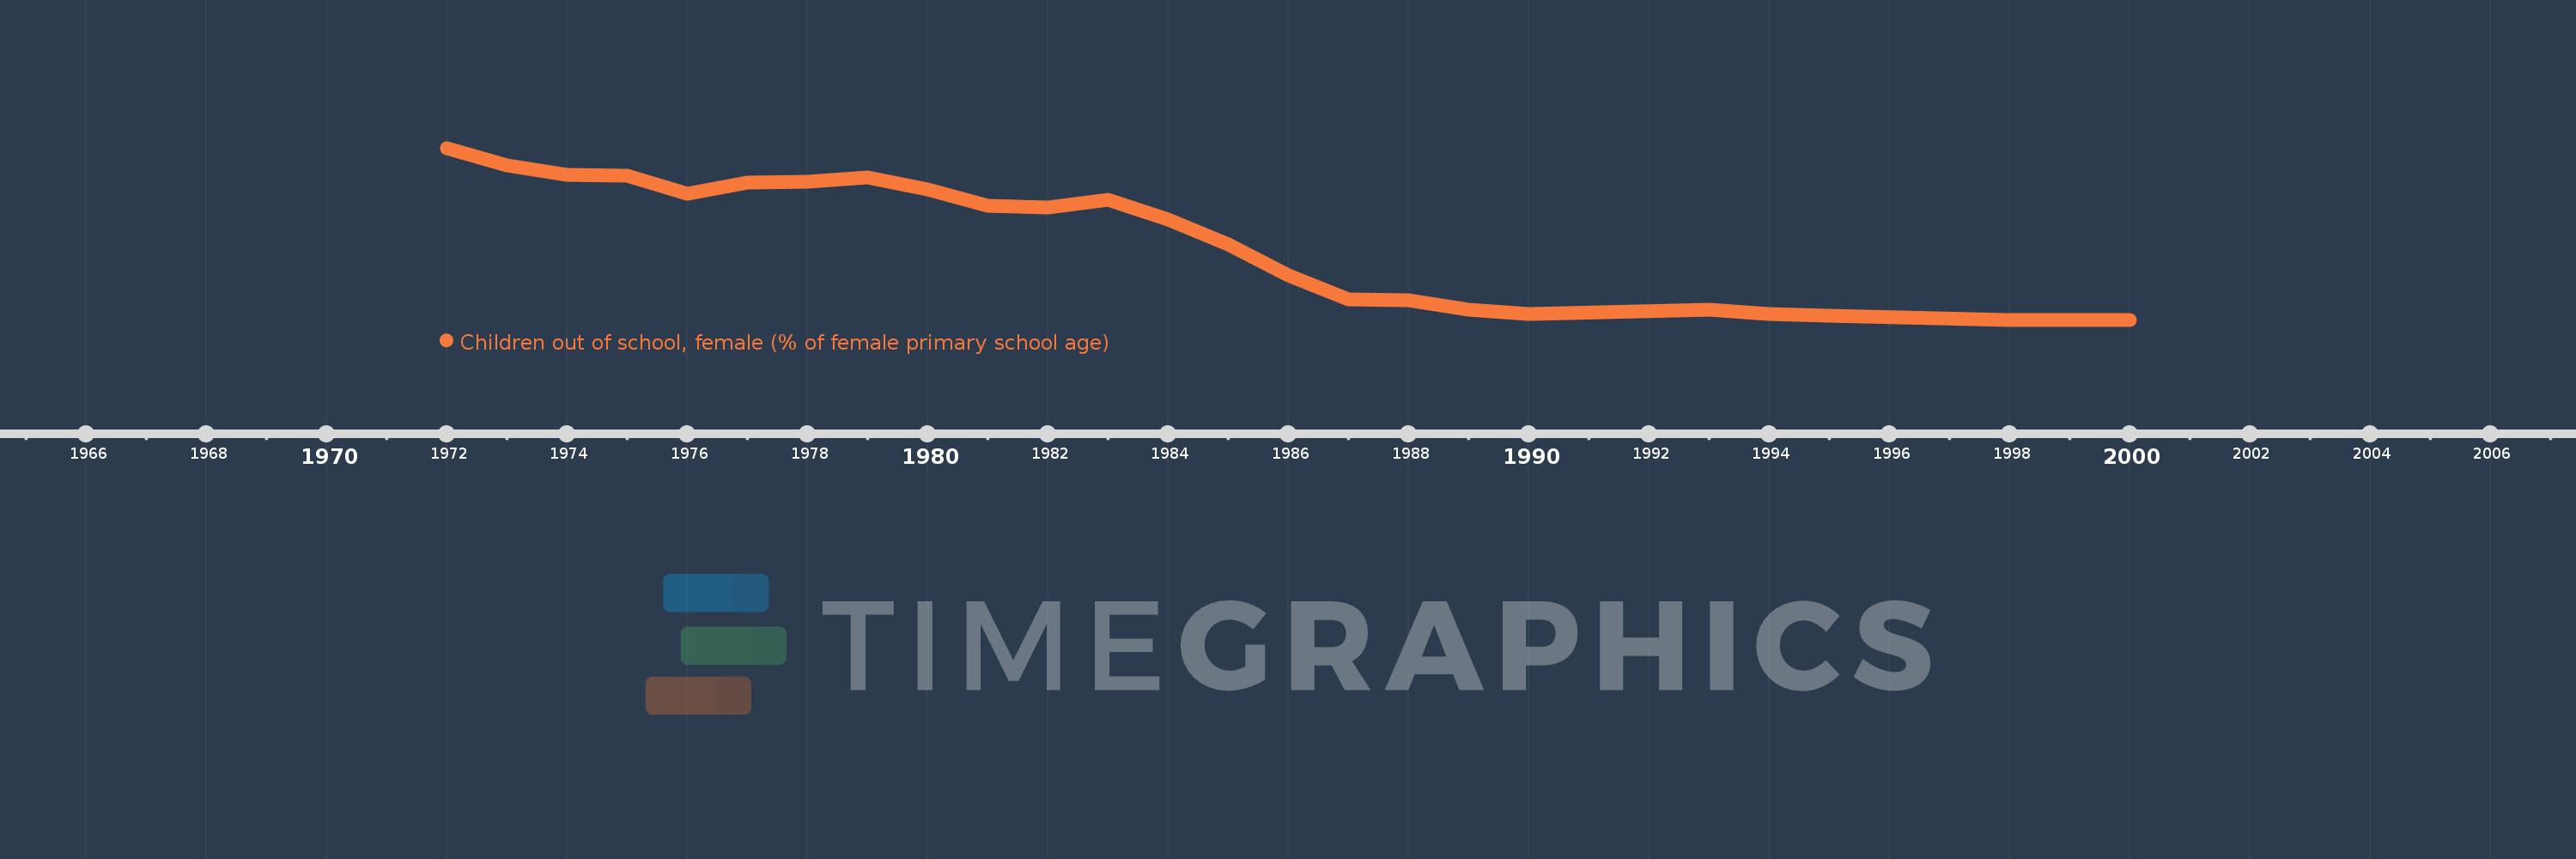
Bahrain
BHR
true
2
1
Children out of school, female (% of female primary school age)
2000,1998,1995,1994,1993,1990,1989,1988,1987,1986,1985,1984,1983,1982,1981,1980,1979,1978,1977,1976,1975,1974,1973,1972