33
/
AIzaSyB4mHJ5NPEv-XzF7P6NDYXjlkCWaeKw5bc
November 30, 2025
76630
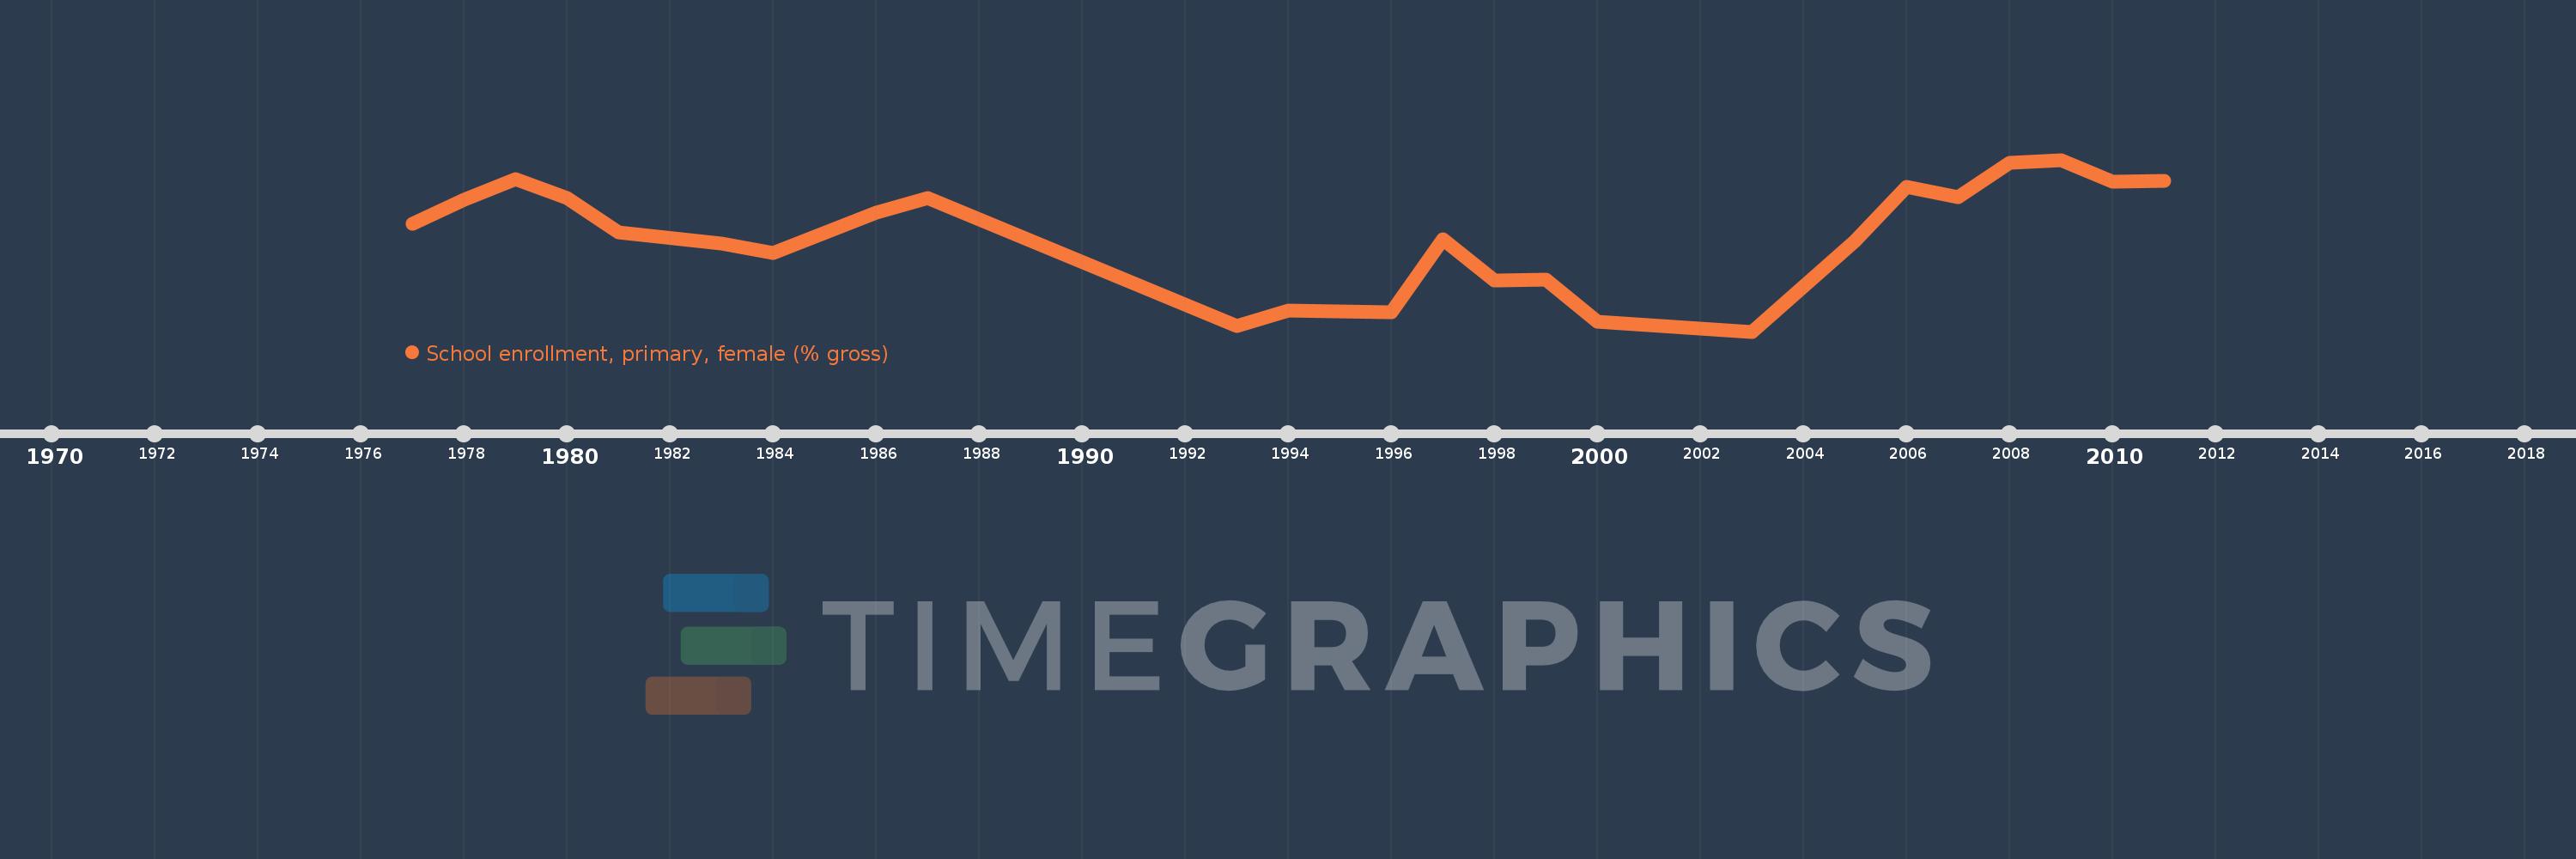
Bahamas, The
BHS
true
2
1
School enrollment, primary, female (% gross)
2011,2010,2009,2008,2007,2006,2005,2003,2000,1999,1998,1997,1996,1994,1993,1987,1986,1984,1983,1981,1980,1979,1978,1977