33
/
AIzaSyB4mHJ5NPEv-XzF7P6NDYXjlkCWaeKw5bc
November 30, 2025
75375
Azerbaijan
AZE
true
2
1
Net financial flows, IMF nonconcessional (NFL, current US$)
2015,2010,2009,2008,2007,2006,2005,2004,2003,2002,2001,2000,1999,1998,1997,1996
Create a timeline
Public Timelines
For education
For educational institutions
For teachers
For students
Cabinet
For educational institutions
For teachers
For students
Open cabinet
FAQ
Close
Create a timeline
Public timelines
FAQ
About & Feedback
Terms
Privacy
FAQ
Support 24/7
Cabinet
Get premium
Donate
Download
Global statistics library
→
Azerbaijan
→
Net financial flows, IMF nonconcessional (NFL, current US$)
This statistics in other country:
Afghanistan
Albania
Algeria
Angola
Argentina
Armenia
Azerbaijan
Bangladesh
Belarus
Belize
Benin
Bhutan
Bolivia
Bosnia and Herzegovina
Botswana
Brazil
Bulgaria
Burkina Faso
Burundi
Cabo Verde
Cambodia
Cameroon
Central African Republic
Chad
Chile
China
Colombia
Comoros
Congo, Dem. Rep.
Congo, Rep.
Costa Rica
Cote d'Ivoire
Djibouti
Dominica
Dominican Republic
East Asia & Pacific (excluding high income)
Ecuador
Egypt, Arab Rep.
El Salvador
Eritrea
Ethiopia
Europe & Central Asia (excluding high income)
Fiji
Gabon
Gambia, The
Georgia
Ghana
Grenada
Guatemala
Guinea
Guinea-Bissau
Guyana
Haiti
Honduras
Hungary
IDA only
India
Indonesia
Jamaica
Jordan
Kazakhstan
Kenya
Kosovo
Kyrgyz Republic
Lao PDR
Latin America & Caribbean (excluding high income)
Latvia
Lebanon
Lesotho
Liberia
Lithuania
Low & middle income
Low income
Lower middle income
Macedonia, FYR
Madagascar
Malawi
Malaysia
Maldives
Mali
Mauritania
Mauritius
Mexico
Middle East & North Africa (excluding high income)
Middle income
Moldova
Mongolia
Morocco
Mozambique
Myanmar
Nepal
Nicaragua
Niger
Nigeria
Pakistan
Panama
Papua New Guinea
Paraguay
Peru
Philippines
Romania
Russian Federation
Rwanda
Samoa
Sao Tome and Principe
Senegal
Serbia
Seychelles
Sierra Leone
Solomon Islands
Somalia
South Africa
South Asia
Sri Lanka
St. Lucia
St. Vincent and the Grenadines
Sub-Saharan Africa (excluding high income)
Sudan
Swaziland
Syrian Arab Republic
Tajikistan
Tanzania
Thailand
Togo
Tonga
Tunisia
Turkey
Turkmenistan
Uganda
Ukraine
Upper middle income
Uruguay
Uzbekistan
Vanuatu
Venezuela, RB
Vietnam
Yemen, Rep.
Zambia
Zimbabwe
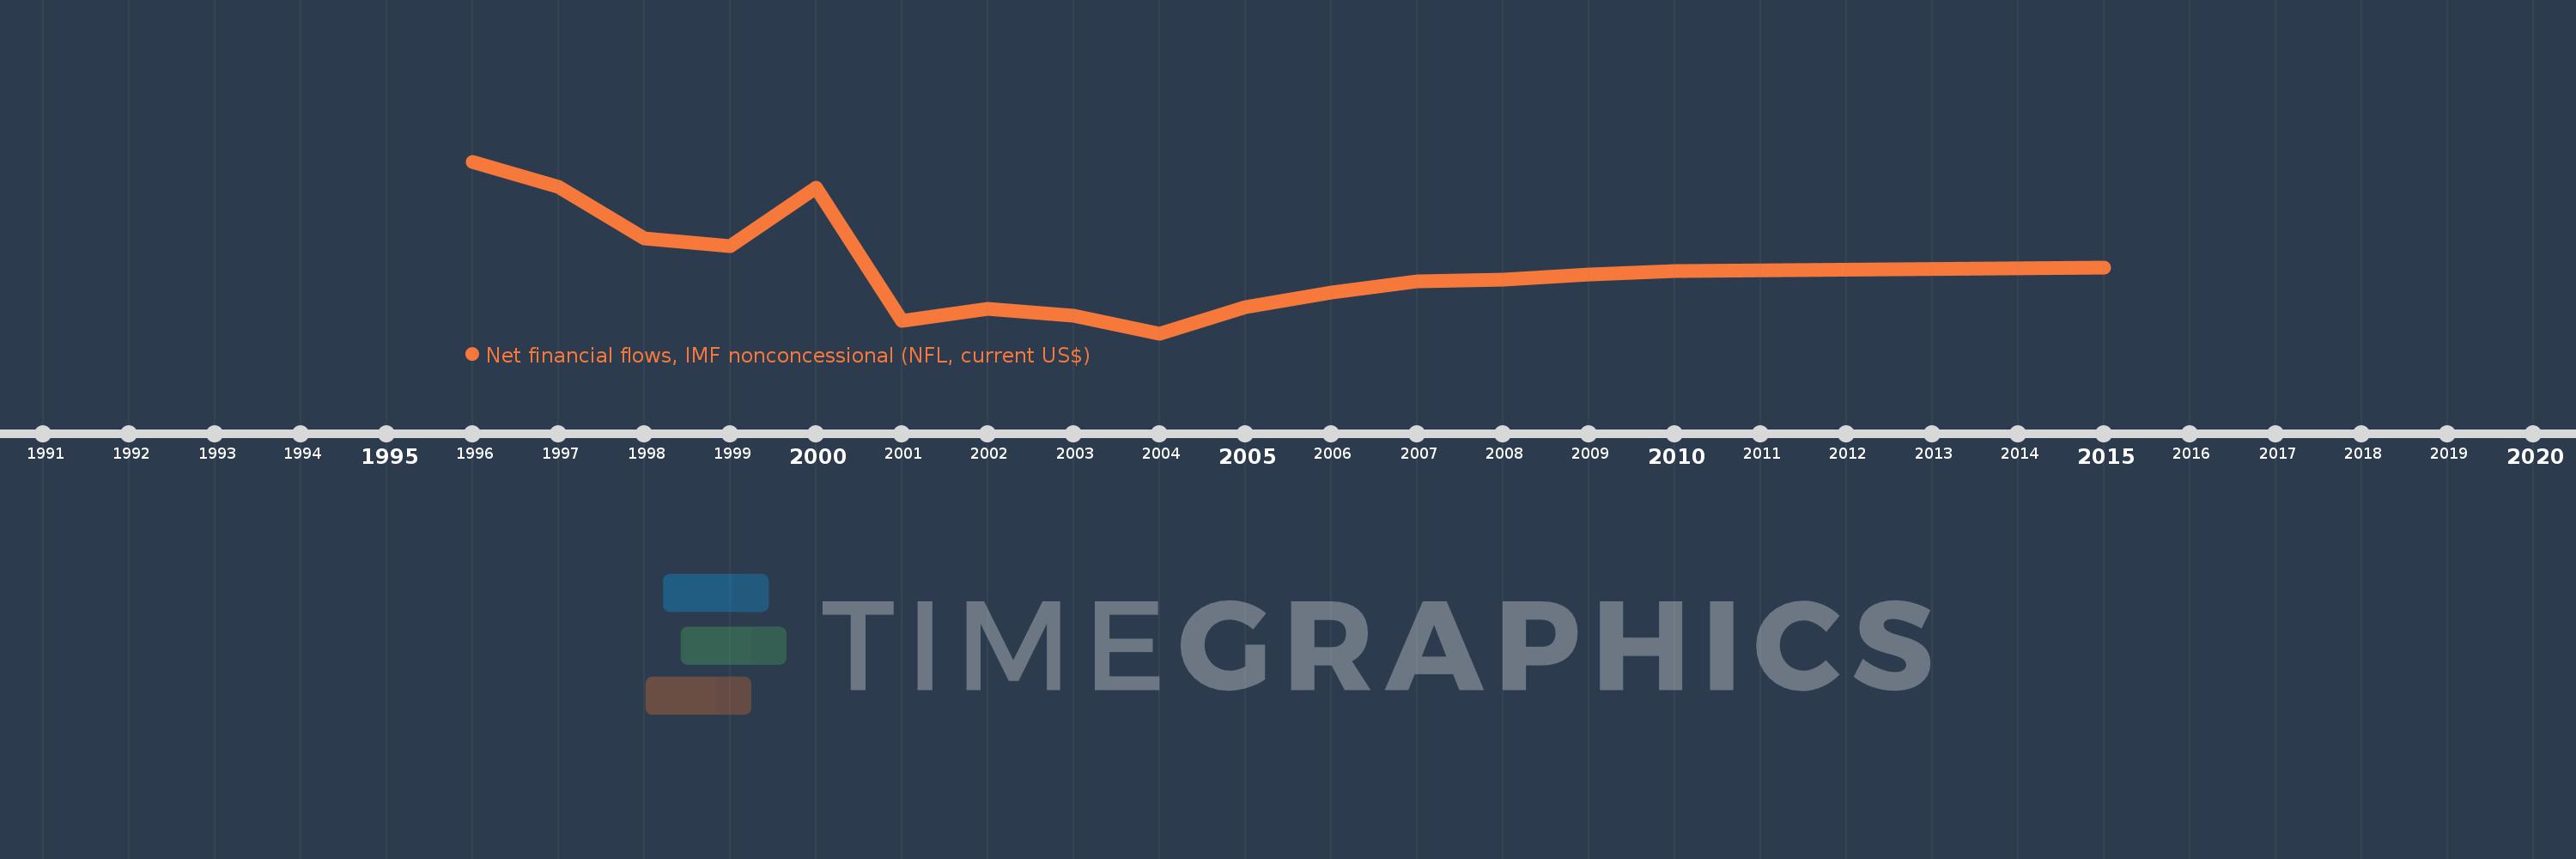
Timeline:
This timeline shows a graph from
1996
to
2015
of Azerbaijan. No data until
1995
. Number of actual observations by date:
16
.
Source name:
World Development Indicators
Source organization:
World Bank, International Debt Statistics.
Categories, topics:
External Debt
Last updated:
apr 23, 2017
Indicators value changes by year
Meaning:
792.625K
Minimum:
-63.319 mln
jan 1, 2004
Maximum:
102.96 mln
jan 1, 1996
At the date of observation
Value
Absolute change
Change from the previous value
jan 1, 1996
102.96 mln
+102.96 mln
0.0%
jan 1, 1997
78.135 mln
-24.825 mln
-24.11%
jan 1, 1998
28.169 mln
-49.966 mln
-63.95%
jan 1, 1999
21.424 mln
-6.745 mln
-23.94%
jan 1, 2000
77.793 mln
+56.369 mln
263.11%
jan 1, 2001
-51.441 mln
-129.234 mln
-166.13%
jan 1, 2002
-39.317 mln
+12.124 mln
-23.57%
jan 1, 2003
-46.345 mln
-7.028 mln
17.88%
jan 1, 2004
-63.319 mln
-16.974 mln
36.63%
jan 1, 2005
-38.033 mln
+25.286 mln
-39.93%
jan 1, 2006
-23.912 mln
+14.121 mln
-37.13%
jan 1, 2007
-13.056 mln
+10.856 mln
-45.4%
jan 1, 2008
-11.195 mln
+1.861 mln
-14.25%
jan 1, 2009
-6.246 mln
+4.949 mln
-44.21%
jan 1, 2010
-2.935 mln
+3.311 mln
-53.01%
jan 1, 2015
0.0
+2.935 mln
-100.0%
Ranking of countries by current statistics by years
About & Feedback
Terms
Privacy
FAQ
Support 24/7
Cabinet
Get premium
Donate
The service accepts bank transfer (ACH, Wire) or cards (Visa, MasterCard, etc). Processed by Stripe.
Secured with SSL