33
/
AIzaSyB4mHJ5NPEv-XzF7P6NDYXjlkCWaeKw5bc
November 30, 2025
73288
Australia
AUS
true
2
1
New businesses registered (number)
2015,2013,2012,2011,2010,2009,2008,2007,2006,2005
Create a timeline
Public Timelines
For education
For educational institutions
For teachers
For students
Cabinet
For educational institutions
For teachers
For students
Open cabinet
FAQ
Close
Create a timeline
Public timelines
FAQ
About & Feedback
Terms
Privacy
FAQ
Support 24/7
Cabinet
Get premium
Donate
Download
Global statistics library
→
Australia
→
New businesses registered (number)
This statistics in other country:
Afghanistan
Albania
Algeria
Antigua and Barbuda
Argentina
Armenia
Australia
Austria
Azerbaijan
Bangladesh
Belarus
Belgium
Belize
Bhutan
Bolivia
Bosnia and Herzegovina
Botswana
Brazil
British Virgin Islands
Bulgaria
Burkina Faso
Cambodia
Canada
Chile
Colombia
Congo, Dem. Rep.
Costa Rica
Croatia
Cyprus
Czech Republic
Denmark
Dominica
Dominican Republic
Egypt, Arab Rep.
El Salvador
Estonia
Ethiopia
Finland
France
Gabon
Georgia
Germany
Ghana
Greece
Grenada
Guatemala
Guinea
Haiti
Hong Kong SAR, China
Hungary
Iceland
India
Indonesia
Iraq
Ireland
Isle of Man
Israel
Italy
Jamaica
Japan
Jordan
Kazakhstan
Kenya
Kiribati
Korea, Rep.
Kosovo
Kyrgyz Republic
Lao PDR
Latvia
Lesotho
Liechtenstein
Lithuania
Luxembourg
Macedonia, FYR
Madagascar
Malawi
Malaysia
Maldives
Malta
Mauritius
Mexico
Moldova
Mongolia
Montenegro
Morocco
Namibia
Nepal
Netherlands
New Zealand
Niger
Nigeria
Norway
Oman
Pakistan
Panama
Peru
Philippines
Poland
Portugal
Qatar
Romania
Russian Federation
Rwanda
Samoa
Sao Tome and Principe
Senegal
Serbia
Sierra Leone
Singapore
Slovak Republic
Slovenia
South Africa
South Sudan
Spain
Sri Lanka
St. Kitts and Nevis
St. Lucia
St. Vincent and the Grenadines
Suriname
Sweden
Switzerland
Syrian Arab Republic
Tajikistan
Thailand
Timor-Leste
Togo
Tonga
Tunisia
Turkey
Uganda
Ukraine
United Arab Emirates
United Kingdom
Uruguay
Uzbekistan
Vanuatu
Zambia
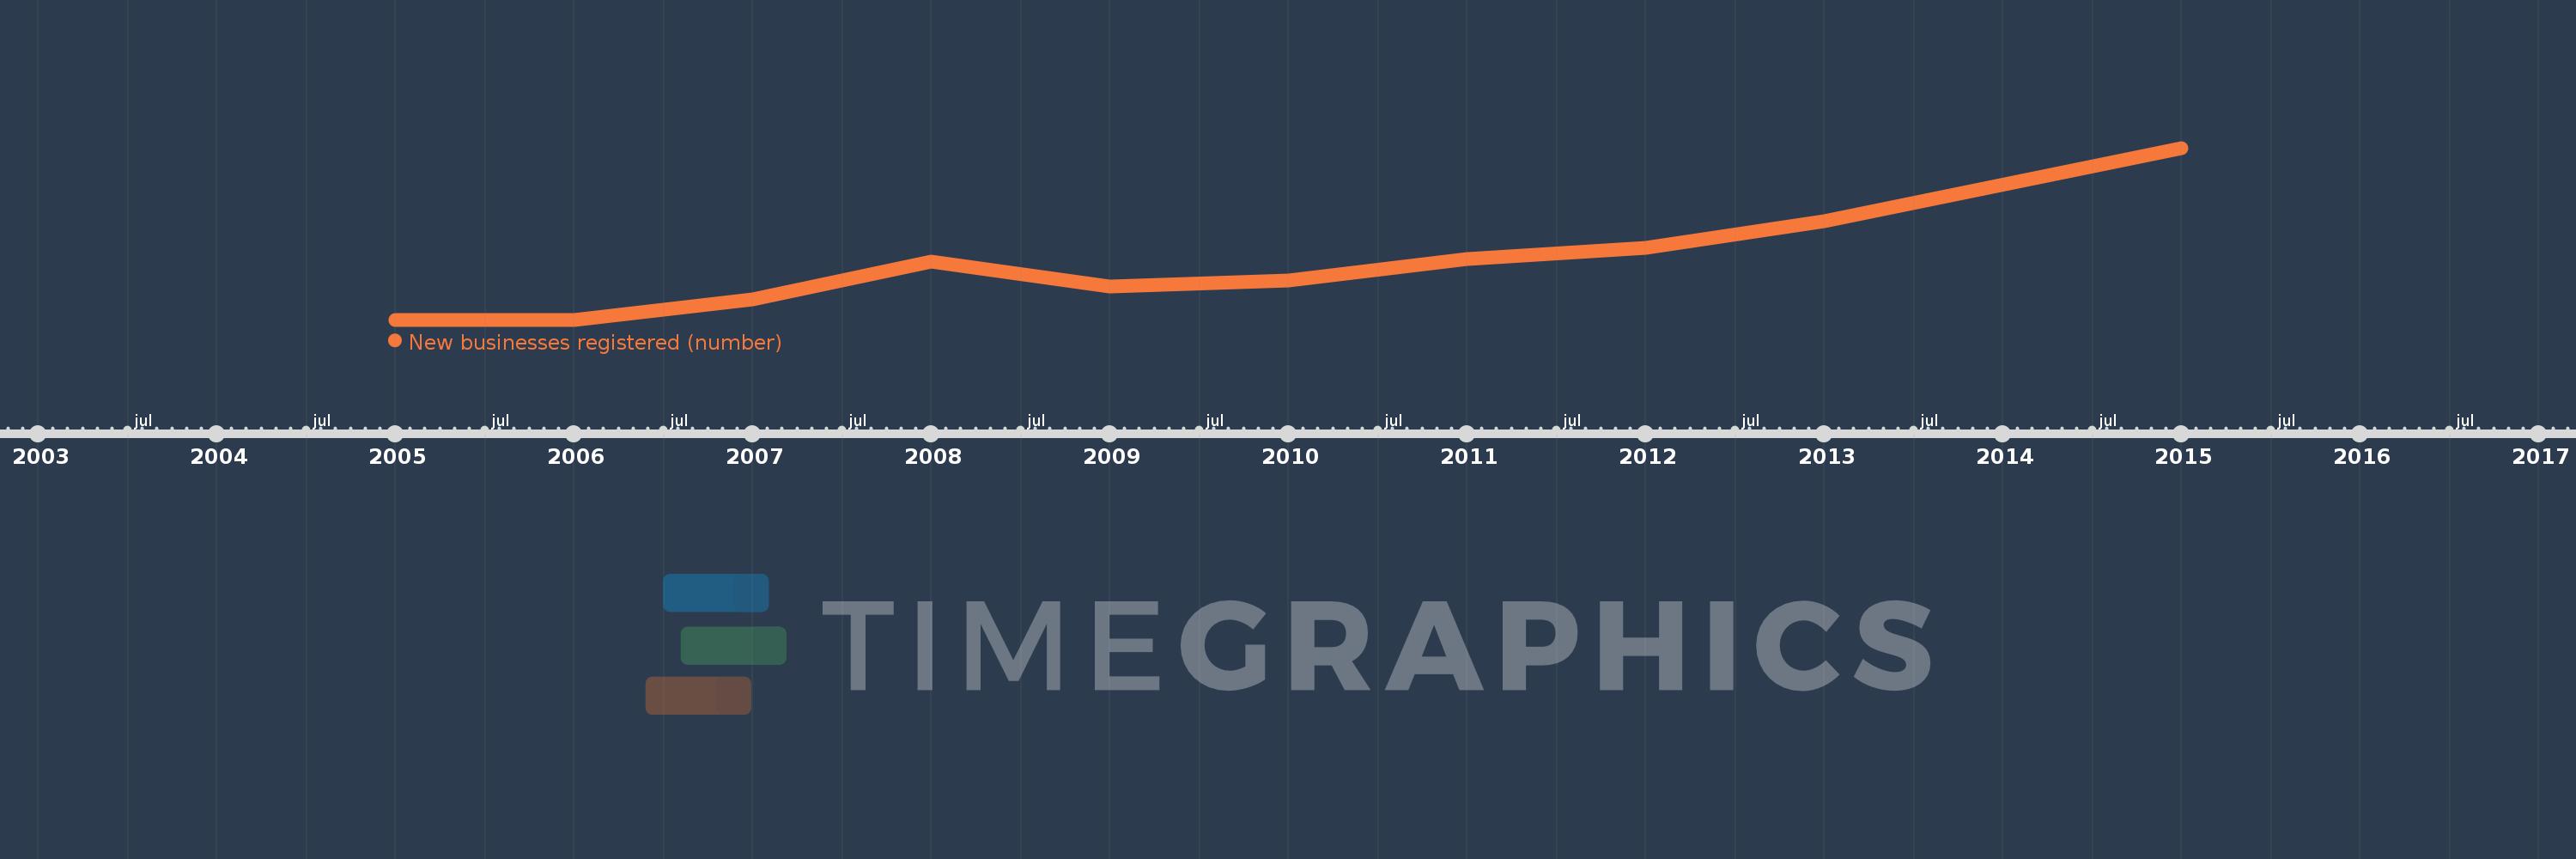
Timeline:
This timeline shows a graph from
2005
to
2015
of Australia. No data until
2004
. Number of actual observations by date:
10
.
Source name:
World Development Indicators
Source organization:
World Bank's Entrepreneurship Survey and database (http://econ.worldbank.org/research/entrepreneurship).
Categories, topics:
Private Sector
Last updated:
apr 23, 2017
Indicators value changes by year
Meaning:
157.43K
Minimum:
121.986K
jan 1, 2005
Maximum:
231.92K
jan 1, 2015
At the date of observation
Value
Absolute change
Change from the previous value
jan 1, 2005
121.986K
+121.986K
0.0%
jan 1, 2006
121.994K
+8.0
0.01%
jan 1, 2007
135.092K
+13.098K
10.74%
jan 1, 2008
159.108K
+24.016K
17.78%
jan 1, 2009
143.153K
-15.955K
-10.03%
jan 1, 2010
147.258K
+4.105K
2.87%
jan 1, 2011
160.615K
+13.357K
9.07%
jan 1, 2012
168.17K
+7.555K
4.7%
jan 1, 2013
185.009K
+16.839K
10.01%
jan 1, 2015
231.92K
+46.911K
25.36%
Ranking of countries by current statistics by years
About & Feedback
Terms
Privacy
FAQ
Support 24/7
Cabinet
Get premium
Donate
The service accepts bank transfer (ACH, Wire) or cards (Visa, MasterCard, etc). Processed by Stripe.
Secured with SSL