33
/
AIzaSyB4mHJ5NPEv-XzF7P6NDYXjlkCWaeKw5bc
November 30, 2025
72237
Aruba
ABW
true
2
1
Grants, excluding technical cooperation (BoP, current US$)
2003,2002,2001,2000,1999,1998,1997,1996,1995,1994,1993,1992,1991,1990,1989,1988,1987
Create a timeline
Public Timelines
For education
For educational institutions
For teachers
For students
Cabinet
For educational institutions
For teachers
For students
Open cabinet
FAQ
Close
Create a timeline
Public timelines
FAQ
About & Feedback
Terms
Privacy
FAQ
Support 24/7
Cabinet
Get premium
Donate
Download
Global statistics library
→
Aruba
→
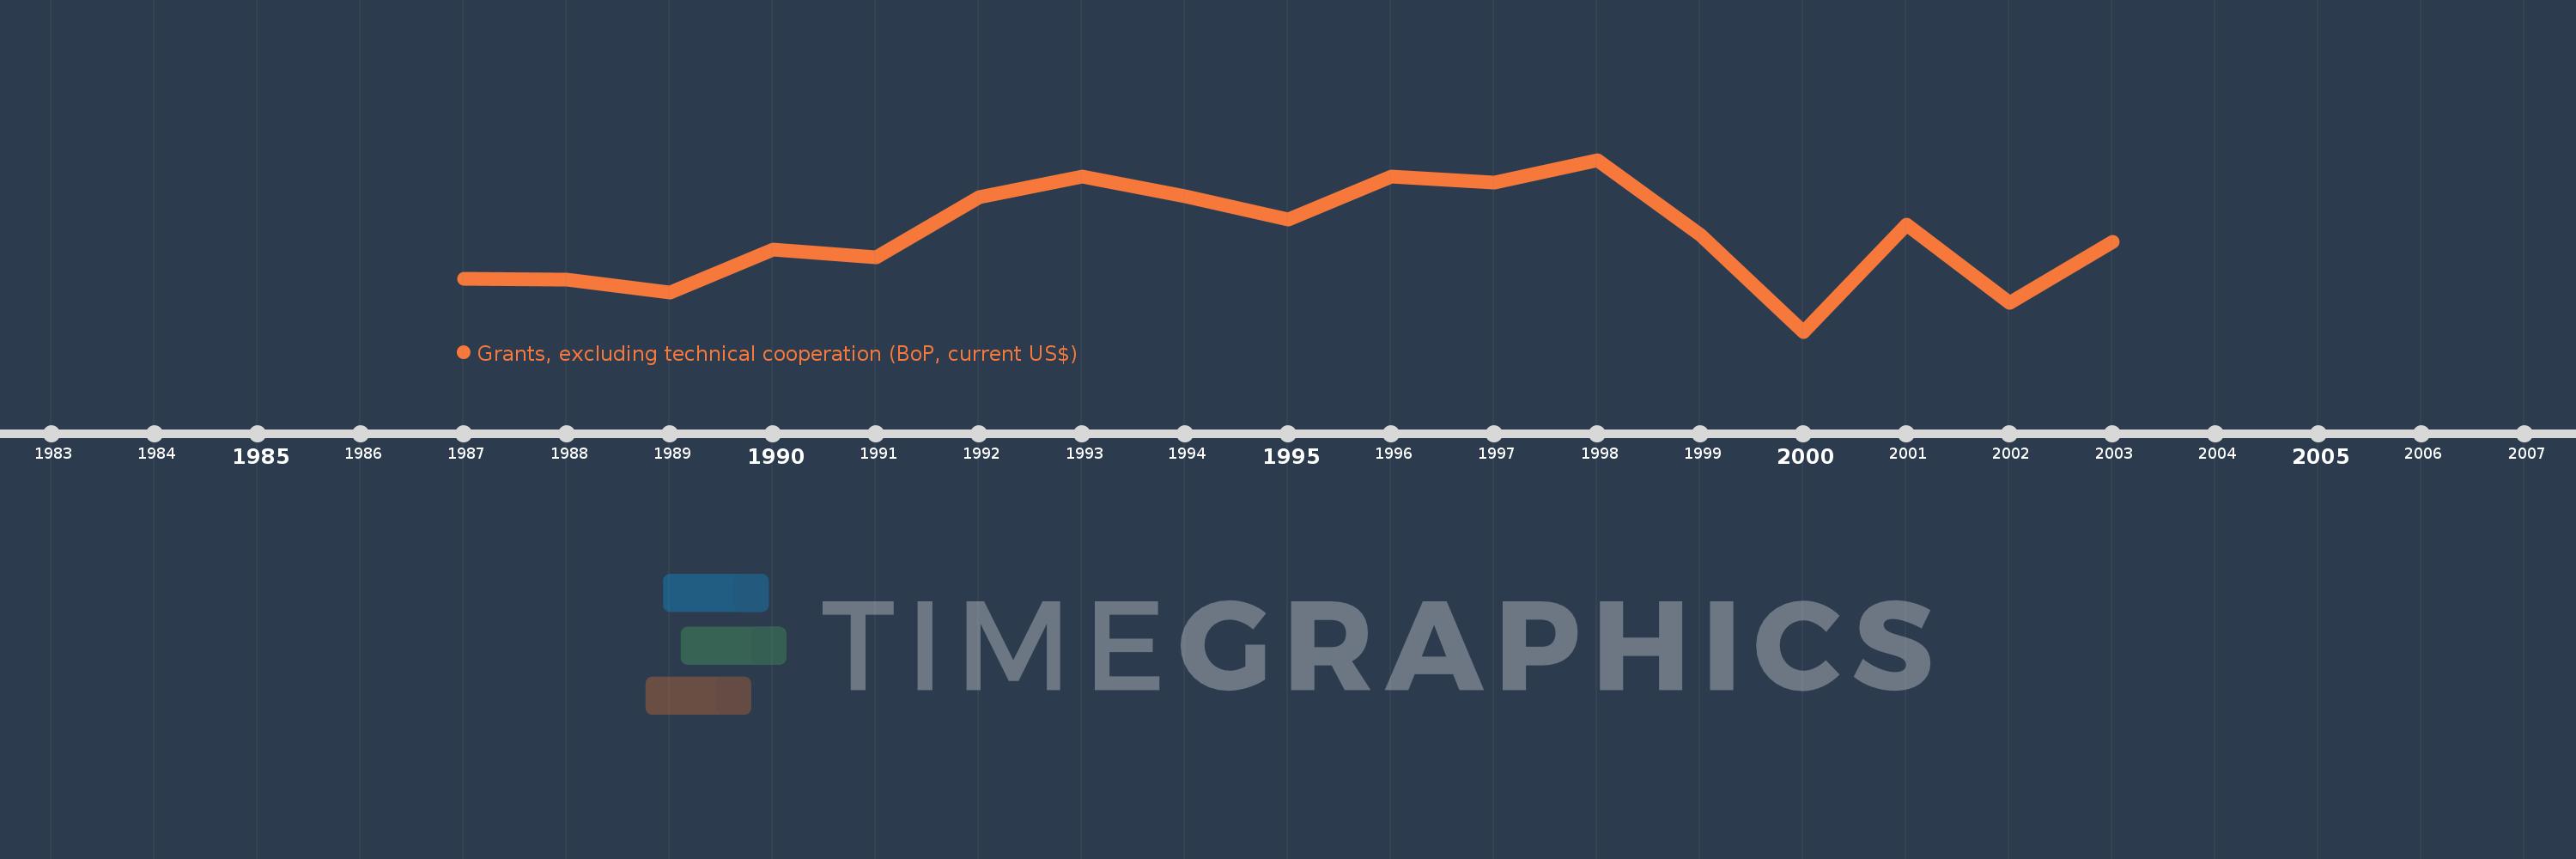
Grants, excluding technical cooperation (BoP, current US$)
This statistics in other country:
Afghanistan
Albania
Algeria
Angola
Antigua and Barbuda
Argentina
Armenia
Aruba
Azerbaijan
Bahamas, The
Bahrain
Bangladesh
Barbados
Belarus
Belize
Benin
Bermuda
Bhutan
Bolivia
Bosnia and Herzegovina
Botswana
Brazil
Brunei Darussalam
Burkina Faso
Burundi
Cabo Verde
Cambodia
Cameroon
Cayman Islands
Central African Republic
Chad
Chile
China
Colombia
Comoros
Congo, Dem. Rep.
Congo, Rep.
Costa Rica
Cote d'Ivoire
Croatia
Cuba
Cyprus
Djibouti
Dominica
Dominican Republic
Ecuador
Egypt, Arab Rep.
El Salvador
Equatorial Guinea
Eritrea
Ethiopia
Fiji
French Polynesia
Gabon
Gambia, The
Georgia
Ghana
Gibraltar
Grenada
Guatemala
Guinea
Guinea-Bissau
Guyana
Haiti
Honduras
Hong Kong SAR, China
India
Indonesia
Iran, Islamic Rep.
Iraq
Israel
Jamaica
Jordan
Kazakhstan
Kenya
Kiribati
Korea, Dem. People’s Rep.
Korea, Rep.
Kosovo
Kuwait
Kyrgyz Republic
Lao PDR
Lebanon
Lesotho
Liberia
Libya
Low & middle income
Macedonia, FYR
Madagascar
Malawi
Malaysia
Maldives
Mali
Malta
Marshall Islands
Mauritania
Mauritius
Mexico
Micronesia, Fed. Sts.
Moldova
Mongolia
Montenegro
Morocco
Mozambique
Myanmar
Namibia
Nepal
New Caledonia
Nicaragua
Niger
Nigeria
Oman
Pakistan
Palau
Panama
Papua New Guinea
Paraguay
Peru
Philippines
Qatar
Rwanda
Samoa
Sao Tome and Principe
Saudi Arabia
Senegal
Serbia
Seychelles
Sierra Leone
Singapore
Slovenia
Solomon Islands
Somalia
South Africa
South Sudan
Sri Lanka
St. Kitts and Nevis
St. Lucia
St. Vincent and the Grenadines
Sudan
Suriname
Swaziland
Syrian Arab Republic
Tajikistan
Tanzania
Thailand
Timor-Leste
Togo
Tonga
Trinidad and Tobago
Tunisia
Turkey
Turkmenistan
Turks and Caicos Islands
Tuvalu
Uganda
Ukraine
United Arab Emirates
Uruguay
Uzbekistan
Vanuatu
Venezuela, RB
Vietnam
West Bank and Gaza
Yemen, Rep.
Zambia
Zimbabwe
Timeline:
This timeline shows a graph from
1987
to
2003
of Aruba. No data until
1986
. Number of actual observations by date:
17
.
Source name:
World Development Indicators
Source organization:
World Bank, International Debt Statistics, and OECD.
Categories, topics:
Economy & Growth, External Debt, Aid Effectiveness
Last updated:
apr 23, 2017
Indicators value changes by year
Meaning:
17.977 mln
Minimum:
40.0K
jan 1, 2000
Maximum:
32.08 mln
jan 1, 1998
At the date of observation
Value
Absolute change
Change from the previous value
jan 1, 1987
9.94 mln
+9.94 mln
0.0%
jan 1, 1988
9.8 mln
-140.0K
-1.41%
jan 1, 1989
7.34 mln
-2.46 mln
-25.1%
jan 1, 1990
15.31 mln
+7.97 mln
108.58%
jan 1, 1991
13.89 mln
-1.42 mln
-9.27%
jan 1, 1992
25.1 mln
+11.21 mln
80.71%
jan 1, 1993
28.92 mln
+3.82 mln
15.22%
jan 1, 1994
25.31 mln
-3.61 mln
-12.48%
jan 1, 1995
20.9 mln
-4.41 mln
-17.42%
jan 1, 1996
28.9 mln
+8.0 mln
38.28%
jan 1, 1997
27.76 mln
-1.14 mln
-3.94%
jan 1, 1998
32.08 mln
+4.32 mln
15.56%
jan 1, 1999
18.14 mln
-13.94 mln
-43.45%
jan 1, 2000
40.0K
-18.1 mln
-99.78%
jan 1, 2001
19.95 mln
+19.91 mln
49.77K%
jan 1, 2002
5.37 mln
-14.58 mln
-73.08%
jan 1, 2003
16.86 mln
+11.49 mln
213.97%
Ranking of countries by current statistics by years
About & Feedback
Terms
Privacy
FAQ
Support 24/7
Cabinet
Get premium
Donate
The service accepts bank transfer (ACH, Wire) or cards (Visa, MasterCard, etc). Processed by Stripe.
Secured with SSL