33
/
AIzaSyB4mHJ5NPEv-XzF7P6NDYXjlkCWaeKw5bc
November 30, 2025
72014
Armenia
ARM
true
2
1
Use of IMF credit (DOD, current US$)
2016,2015,2014,2013,2012,2011,2010,2009,2008,2007,2006,2005,2004,2003,2002,2001,2000,1999,1998,1997,1996,1995
Create a timeline
Public Timelines
For education
For educational institutions
For teachers
For students
Cabinet
For educational institutions
For teachers
For students
Open cabinet
FAQ
Close
Create a timeline
Public timelines
FAQ
About & Feedback
Terms
Privacy
FAQ
Support 24/7
Cabinet
Get premium
Donate
Download
Global statistics library
→
Armenia
→
Use of IMF credit (DOD, current US$)
This statistics in other country:
Afghanistan
Albania
Algeria
Angola
Argentina
Armenia
Azerbaijan
Bangladesh
Belarus
Belize
Benin
Bhutan
Bolivia
Bosnia and Herzegovina
Botswana
Brazil
Bulgaria
Burkina Faso
Burundi
Cabo Verde
Cambodia
Cameroon
Central African Republic
Chad
China
Colombia
Comoros
Congo, Dem. Rep.
Congo, Rep.
Costa Rica
Cote d'Ivoire
Djibouti
Dominica
Dominican Republic
East Asia & Pacific (excluding high income)
Ecuador
Egypt, Arab Rep.
El Salvador
Eritrea
Ethiopia
Europe & Central Asia (excluding high income)
Fiji
Gabon
Gambia, The
Georgia
Ghana
Grenada
Guatemala
Guinea
Guinea-Bissau
Guyana
Haiti
Honduras
IDA only
India
Indonesia
Iran, Islamic Rep.
Jamaica
Jordan
Kazakhstan
Kenya
Kosovo
Kyrgyz Republic
Lao PDR
Latin America & Caribbean (excluding high income)
Lebanon
Lesotho
Liberia
Low & middle income
Low income
Lower middle income
Macedonia, FYR
Madagascar
Malawi
Malaysia
Maldives
Mali
Mauritania
Mauritius
Mexico
Middle East & North Africa (excluding high income)
Middle income
Moldova
Mongolia
Montenegro
Morocco
Mozambique
Myanmar
Nepal
Nicaragua
Niger
Nigeria
Pakistan
Panama
Papua New Guinea
Paraguay
Peru
Philippines
Romania
Russian Federation
Rwanda
Samoa
Sao Tome and Principe
Senegal
Serbia
Sierra Leone
Solomon Islands
Somalia
South Africa
South Asia
Sri Lanka
St. Lucia
St. Vincent and the Grenadines
Sub-Saharan Africa (excluding high income)
Sudan
Swaziland
Syrian Arab Republic
Tajikistan
Tanzania
Thailand
Togo
Tonga
Tunisia
Turkey
Turkmenistan
Uganda
Ukraine
Upper middle income
Uzbekistan
Vanuatu
Venezuela, RB
Vietnam
Yemen, Rep.
Zambia
Zimbabwe
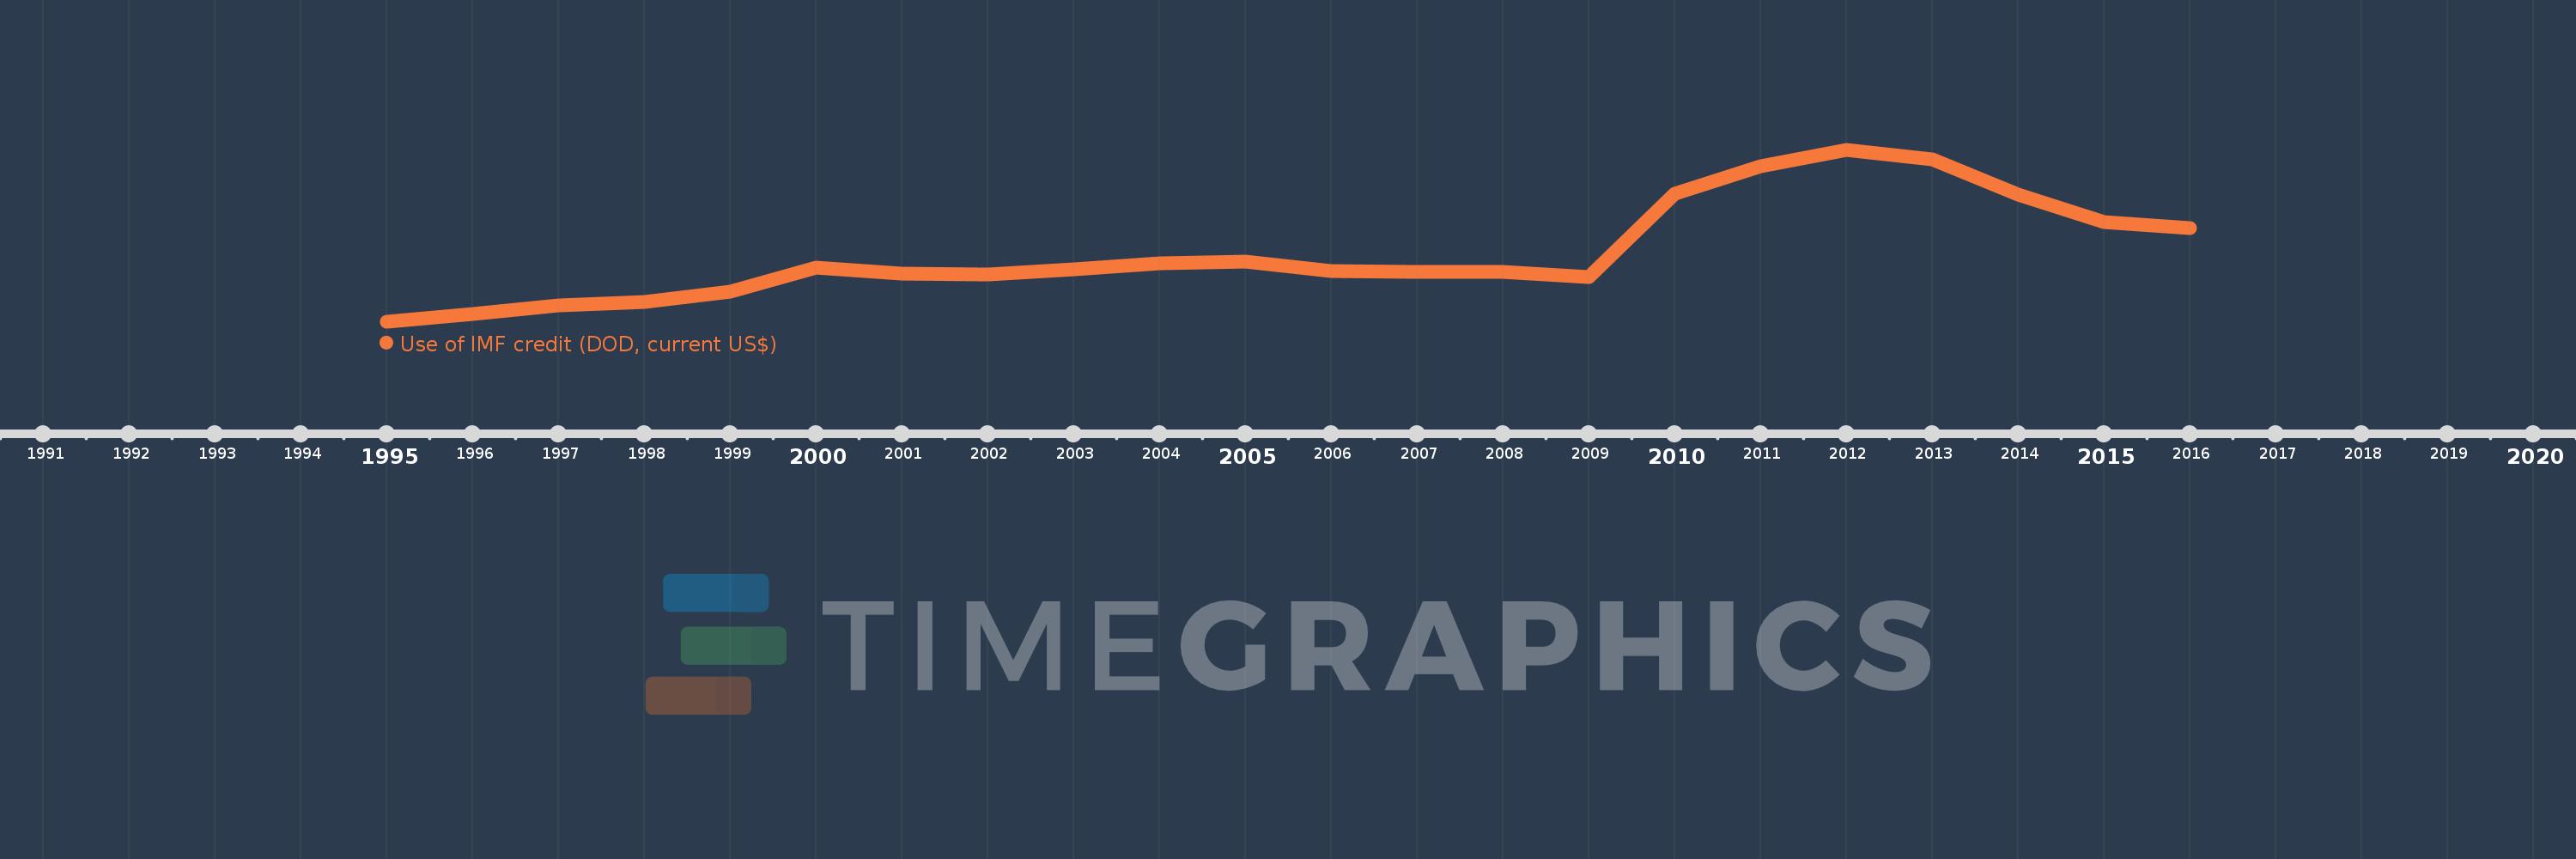
Timeline:
This timeline shows a graph from
1995
to
2016
of Armenia. No data until
1994
. Number of actual observations by date:
22
.
Source name:
World Development Indicators
Source organization:
World Bank, International Debt Statistics.
Categories, topics:
External Debt
Last updated:
apr 23, 2017
Indicators value changes by year
Meaning:
404.981 mln
Minimum:
24.635 mln
jan 1, 1995
Maximum:
962.546 mln
jan 1, 2012
At the date of observation
Value
Absolute change
Change from the previous value
jan 1, 1995
24.635 mln
+24.635 mln
0.0%
jan 1, 1996
70.237 mln
+45.602 mln
185.11%
jan 1, 1997
116.475 mln
+46.238 mln
65.83%
jan 1, 1998
132.058 mln
+15.583 mln
13.38%
jan 1, 1999
190.44 mln
+58.382 mln
44.21%
jan 1, 2000
321.997 mln
+131.557 mln
69.08%
jan 1, 2001
290.095 mln
-31.902 mln
-9.91%
jan 1, 2002
283.191 mln
-6.904 mln
-2.38%
jan 1, 2003
314.425 mln
+31.234 mln
11.03%
jan 1, 2004
345.389 mln
+30.964 mln
9.85%
jan 1, 2005
354.277 mln
+8.888 mln
2.57%
jan 1, 2006
302.159 mln
-52.118 mln
-14.71%
jan 1, 2007
296.043 mln
-6.116 mln
-2.02%
jan 1, 2008
296.949 mln
+906.0K
0.31%
jan 1, 2009
270.294 mln
-26.655 mln
-8.98%
jan 1, 2010
724.647 mln
+454.353 mln
168.1%
jan 1, 2011
876.27 mln
+151.623 mln
20.92%
jan 1, 2012
962.546 mln
+86.276 mln
9.85%
jan 1, 2013
911.324 mln
-51.222 mln
-5.32%
jan 1, 2014
720.312 mln
-191.012 mln
-20.96%
jan 1, 2015
569.572 mln
-150.74 mln
-20.93%
jan 1, 2016
536.257 mln
-33.315 mln
-5.85%
Ranking of countries by current statistics by years
About & Feedback
Terms
Privacy
FAQ
Support 24/7
Cabinet
Get premium
Donate
The service accepts bank transfer (ACH, Wire) or cards (Visa, MasterCard, etc). Processed by Stripe.
Secured with SSL