33
/
AIzaSyB4mHJ5NPEv-XzF7P6NDYXjlkCWaeKw5bc
November 1, 2025
71814
Armenia
ARM
true
2
1
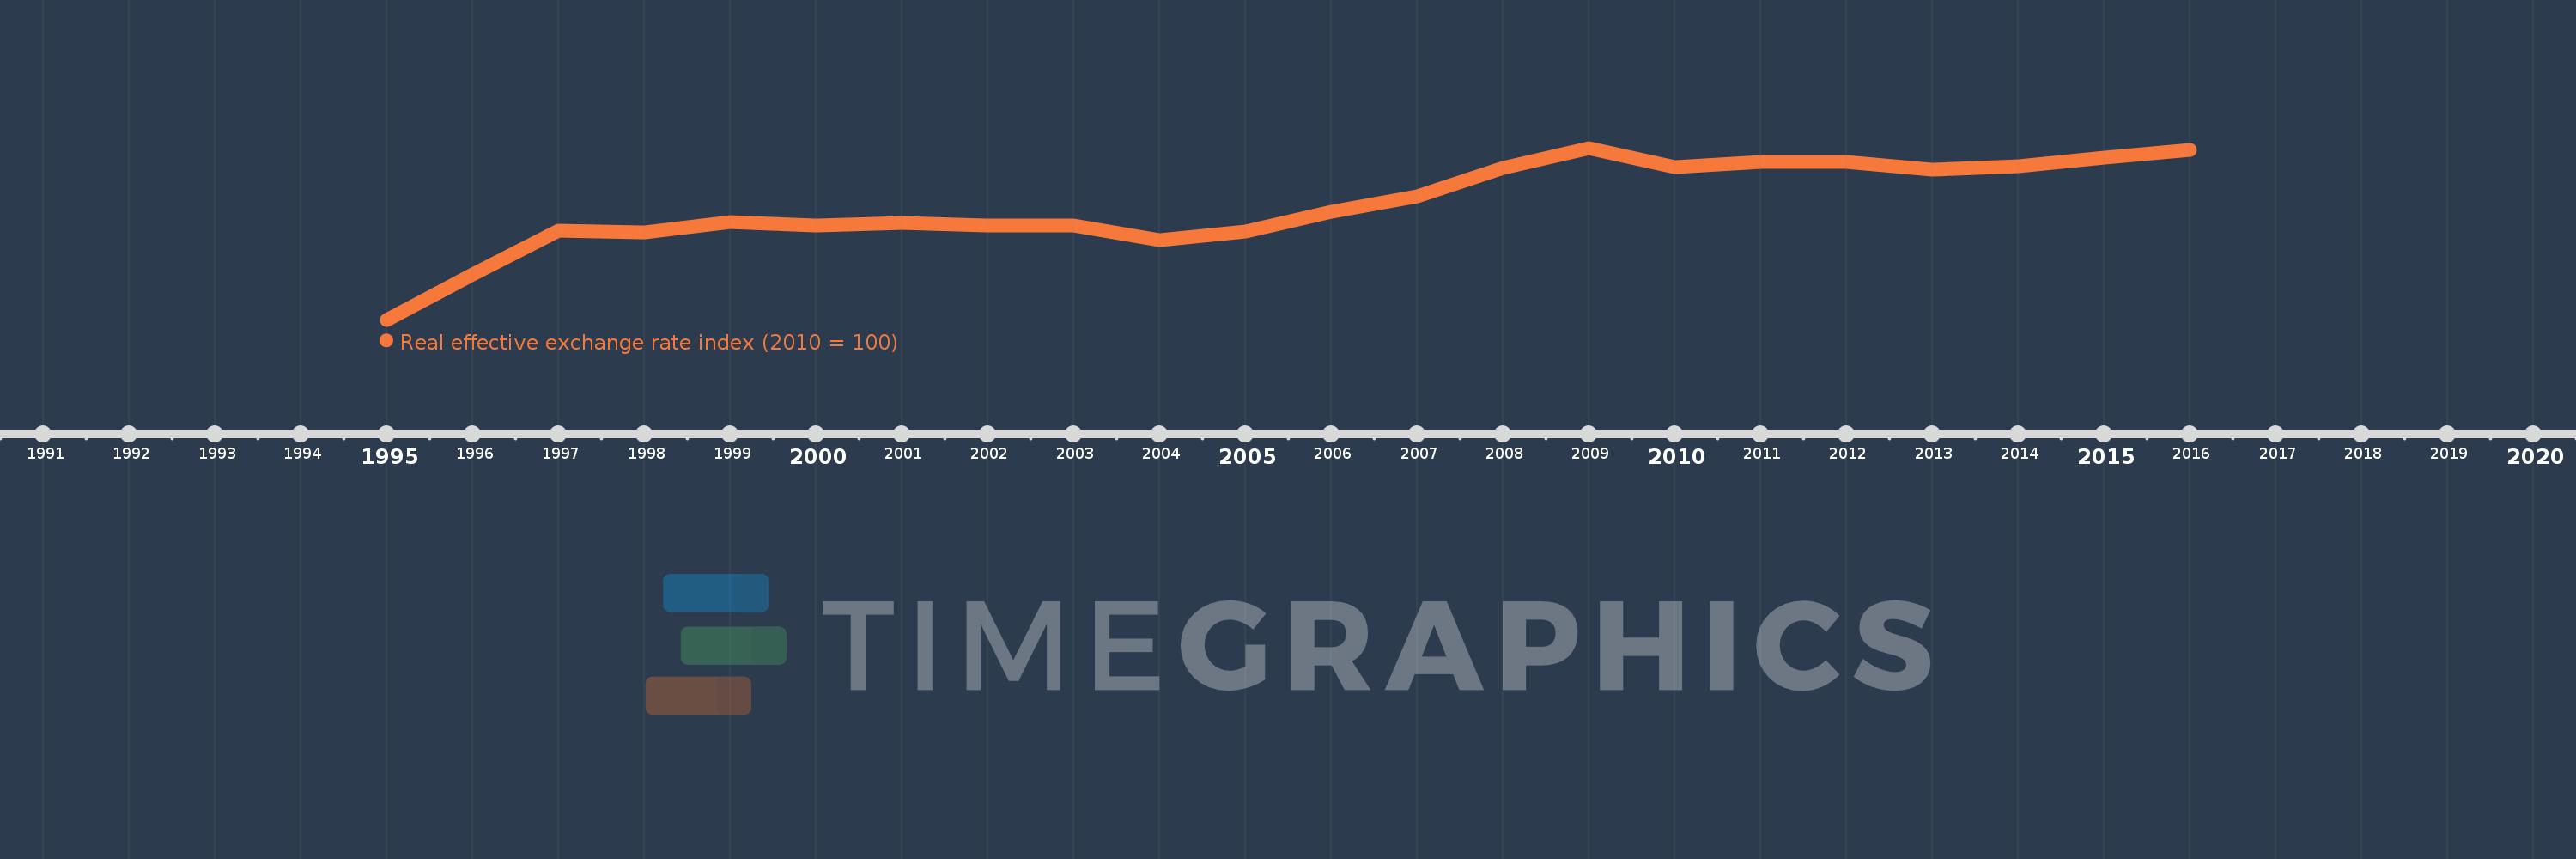
Real effective exchange rate index (2010 = 100)
2016,2015,2014,2013,2012,2011,2010,2009,2008,2007,2006,2005,2004,2003,2002,2001,2000,1999,1998,1997,1996,1995
Create a timeline
Public Timelines
For education
For educational institutions
For teachers
For students
Cabinet
For educational institutions
For teachers
For students
Open cabinet
FAQ
Get premium
Close
Create a timeline
Public timelines
FAQ
About & Feedback
Terms
Privacy
FAQ
Support 24/7
Cabinet
Get premium
Donate
Download
Global statistics library
→
Armenia
→
Real effective exchange rate index (2010 = 100)
This statistics in other country:
Algeria
Antigua and Barbuda
Armenia
Australia
Austria
Bahamas, The
Bahrain
Belgium
Belize
Bolivia
Brazil
Bulgaria
Burundi
Cameroon
Canada
Central African Republic
Chile
China
Colombia
Congo, Dem. Rep.
Costa Rica
Cote d'Ivoire
Croatia
Cyprus
Czech Republic
Denmark
Dominica
Dominican Republic
Ecuador
Equatorial Guinea
Fiji
Finland
France
Gabon
Gambia, The
Georgia
Germany
Ghana
Greece
Grenada
Guyana
Hungary
Iceland
Iran, Islamic Rep.
Ireland
Israel
Italy
Japan
Latvia
Lesotho
Luxembourg
Macedonia, FYR
Malawi
Malaysia
Malta
Mexico
Moldova
Morocco
Netherlands
New Zealand
Nicaragua
Nigeria
Norway
Pakistan
Papua New Guinea
Paraguay
Philippines
Poland
Portugal
Romania
Russian Federation
Samoa
Saudi Arabia
Sierra Leone
Singapore
Slovak Republic
Solomon Islands
South Africa
Spain
St. Kitts and Nevis
St. Lucia
St. Vincent and the Grenadines
Sweden
Switzerland
Togo
Trinidad and Tobago
Tunisia
Uganda
Ukraine
United Kingdom
United States
Uruguay
Venezuela, RB
Zambia
Timeline:
This timeline shows a graph from
1995
to
2016
of Armenia. No data until
1994
. Number of actual observations by date:
22
.
Source name:
World Development Indicators
Source organization:
International Monetary Fund, International Financial Statistics.
Categories, topics:
Financial Sector
Last updated:
apr 23, 2017
Indicators value changes by year
Meaning:
81.715
Minimum:
33.064
jan 1, 1995
Maximum:
105.864
jan 1, 2009
At the date of observation
Value
Absolute change
Change from the previous value
jan 1, 1995
33.064
+33.064
0.0%
jan 1, 1996
52.279
+19.215
58.12%
jan 1, 1997
70.975
+18.696
35.76%
jan 1, 1998
69.939
-1.035
-1.46%
jan 1, 1999
74.313
+4.373
6.25%
jan 1, 2000
72.821
-1.492
-2.01%
jan 1, 2001
73.918
+1.098
1.51%
jan 1, 2002
73.147
-0.771
-1.04%
jan 1, 2003
72.932
-0.215
-0.29%
jan 1, 2004
66.942
-5.989
-8.21%
jan 1, 2005
70.482
+3.54
5.29%
jan 1, 2006
78.672
+8.19
11.62%
jan 1, 2007
85.423
+6.752
8.58%
jan 1, 2008
97.512
+12.089
14.15%
jan 1, 2009
105.864
+8.352
8.56%
jan 1, 2010
97.917
-7.947
-7.51%
jan 1, 2011
100.0
+2.083
2.13%
jan 1, 2012
100.086
+0.086
0.09%
jan 1, 2013
96.818
-3.267
-3.26%
jan 1, 2014
97.969
+1.151
1.19%
jan 1, 2015
101.786
+3.817
3.9%
jan 1, 2016
104.878
+3.092
3.04%
Ranking of countries by current statistics by years
About & Feedback
Terms
Privacy
FAQ
Support 24/7
Cabinet
Get premium
Donate
The service accepts bank transfer (ACH, Wire) or cards (Visa, MasterCard, etc). Processed by Stripe.
Secured with SSL