Download This statistics in other country:
Timeline:
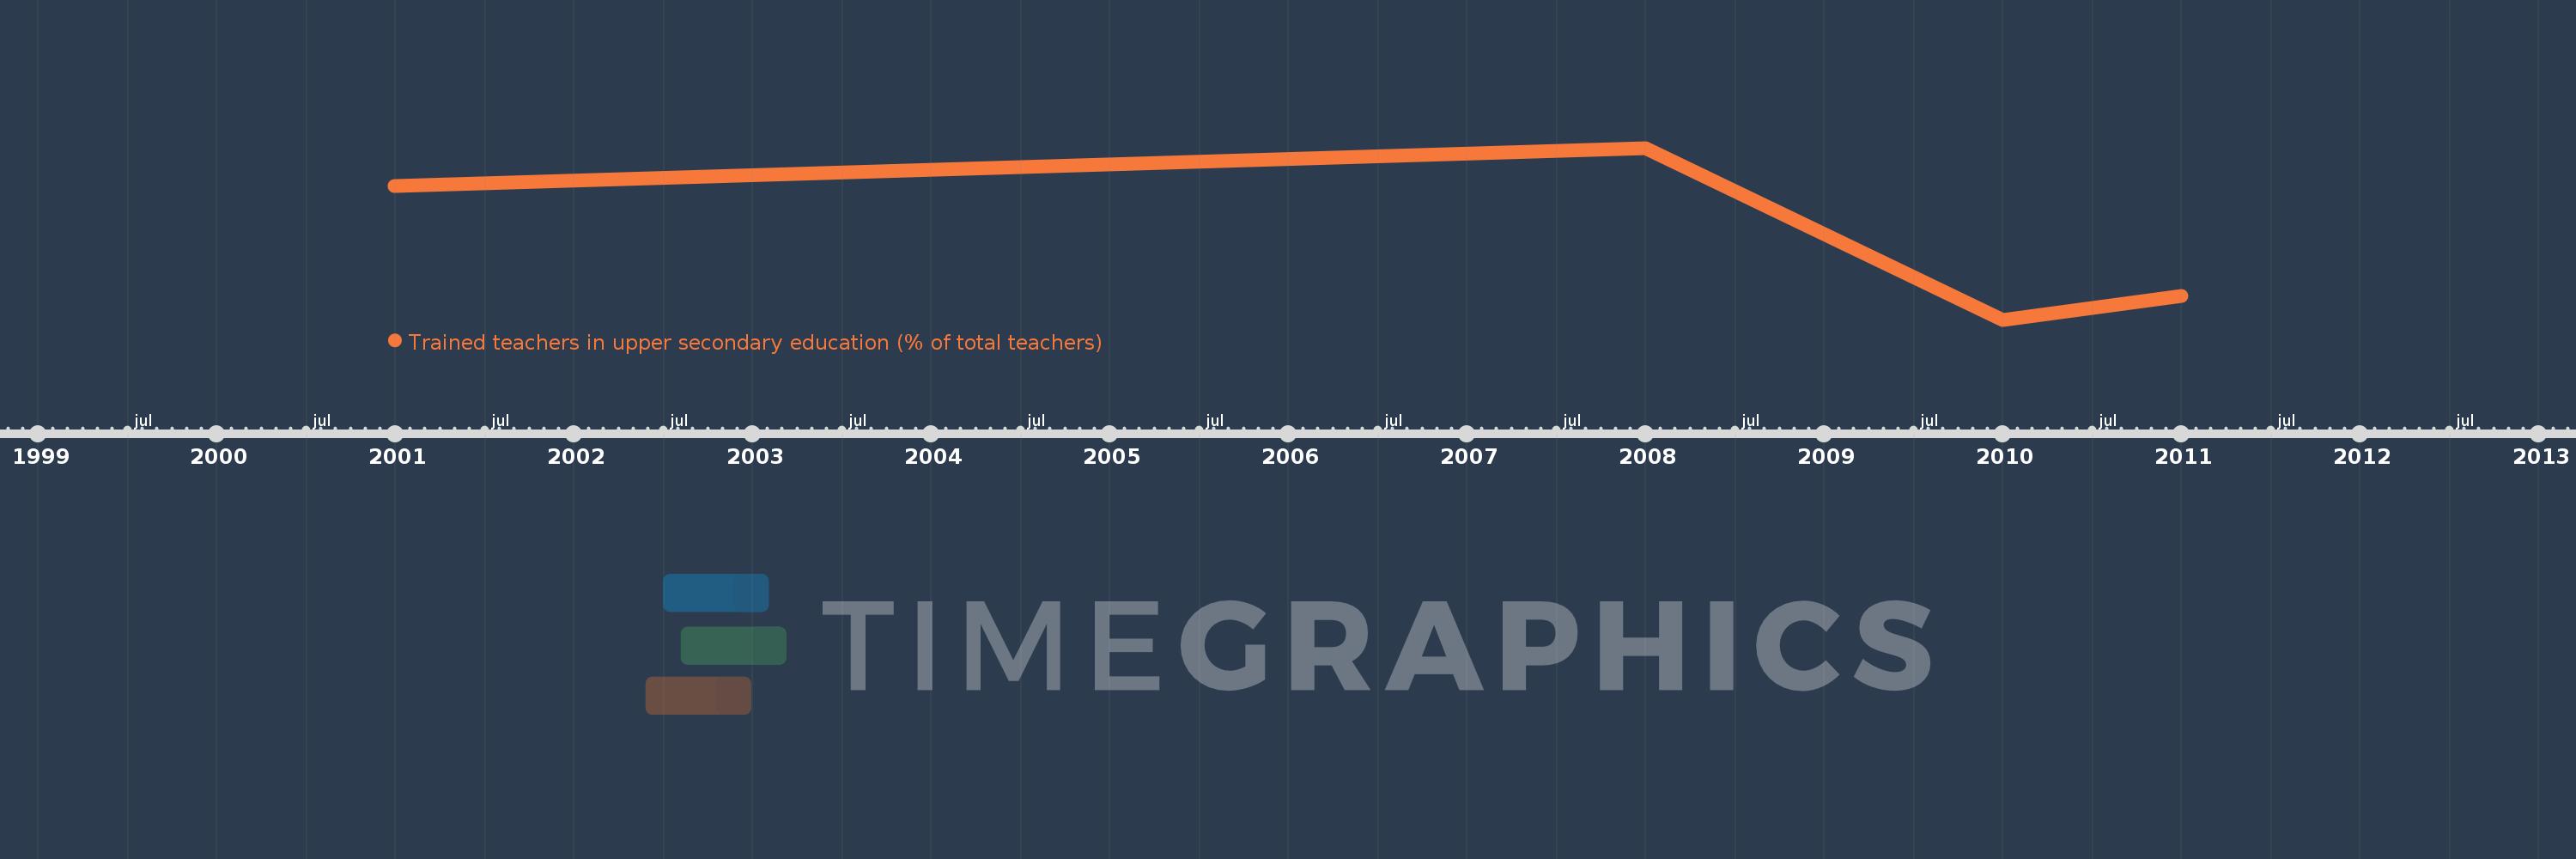
This timeline shows a graph from 2001 to 2011 of Antigua and Barbuda. No data until 2000. Number of actual observations by date: 4.
Source name:
World Development Indicators
Source organization:
United Nations Educational, Scientific, and Cultural Organization (UNESCO) Institute for Statistics.
Categories, topics:
Education
Last updated:
apr 23, 2017
Indicators value changes by year
Minimum:
45.302
jan 1, 2010
Maximum:
66.735
jan 1, 2008
At the date of observation
Value
Absolute change
Change from the previous value
jan 1, 2001
61.983
+61.983
0.0%
jan 1, 2008
66.735
+4.752
7.67%
jan 1, 2010
45.302
-21.433
-32.12%
jan 1, 2011
48.308
+3.006
6.63%
Ranking of countries by current statistics by years