33
/
AIzaSyB4mHJ5NPEv-XzF7P6NDYXjlkCWaeKw5bc
November 30, 2025
69297
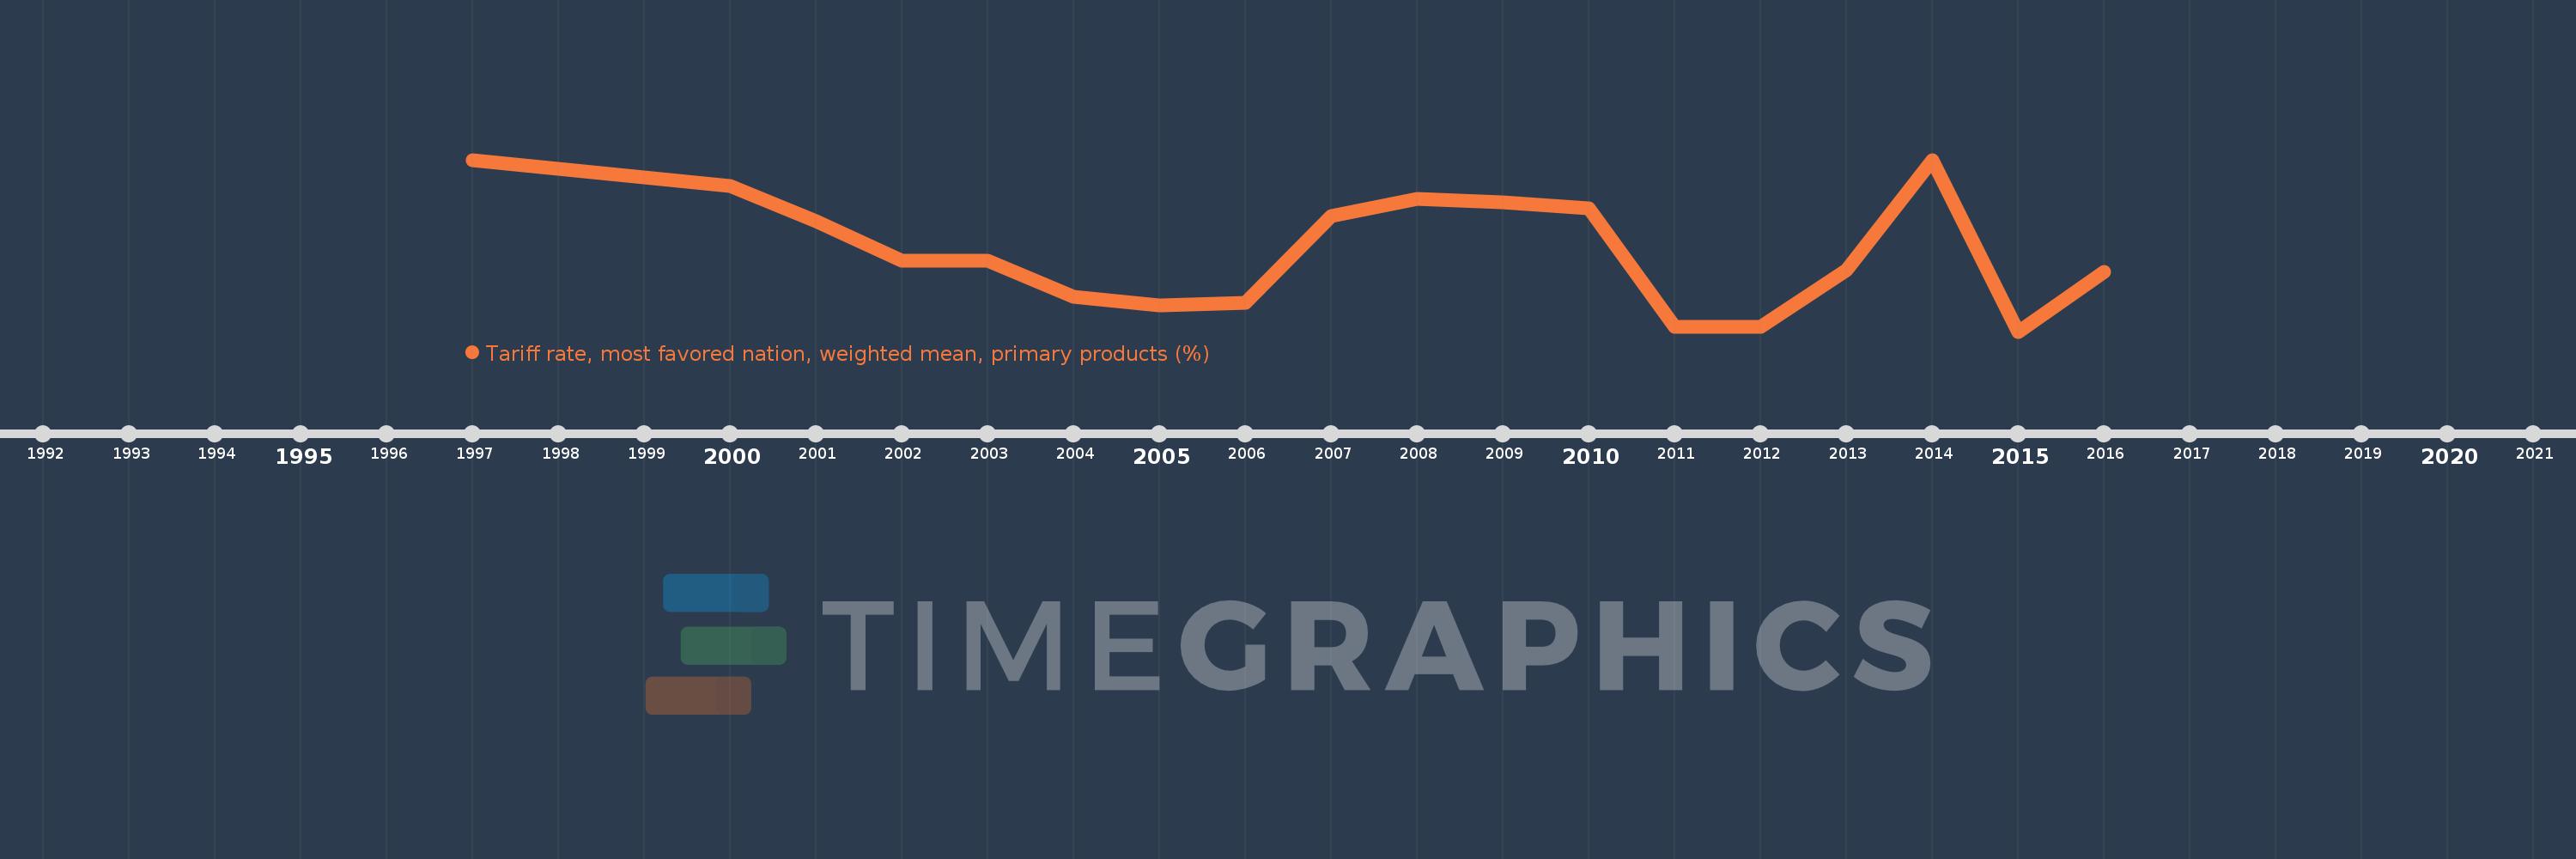
Antigua and Barbuda
ATG
true
2
1
Tariff rate, most favored nation, weighted mean, primary products (%)
2016,2015,2014,2013,2012,2011,2010,2009,2008,2007,2006,2005,2004,2003,2002,2001,2000,1997