33
/
AIzaSyB4mHJ5NPEv-XzF7P6NDYXjlkCWaeKw5bc
November 30, 2025
69152
Antigua and Barbuda
ATG
true
2
1
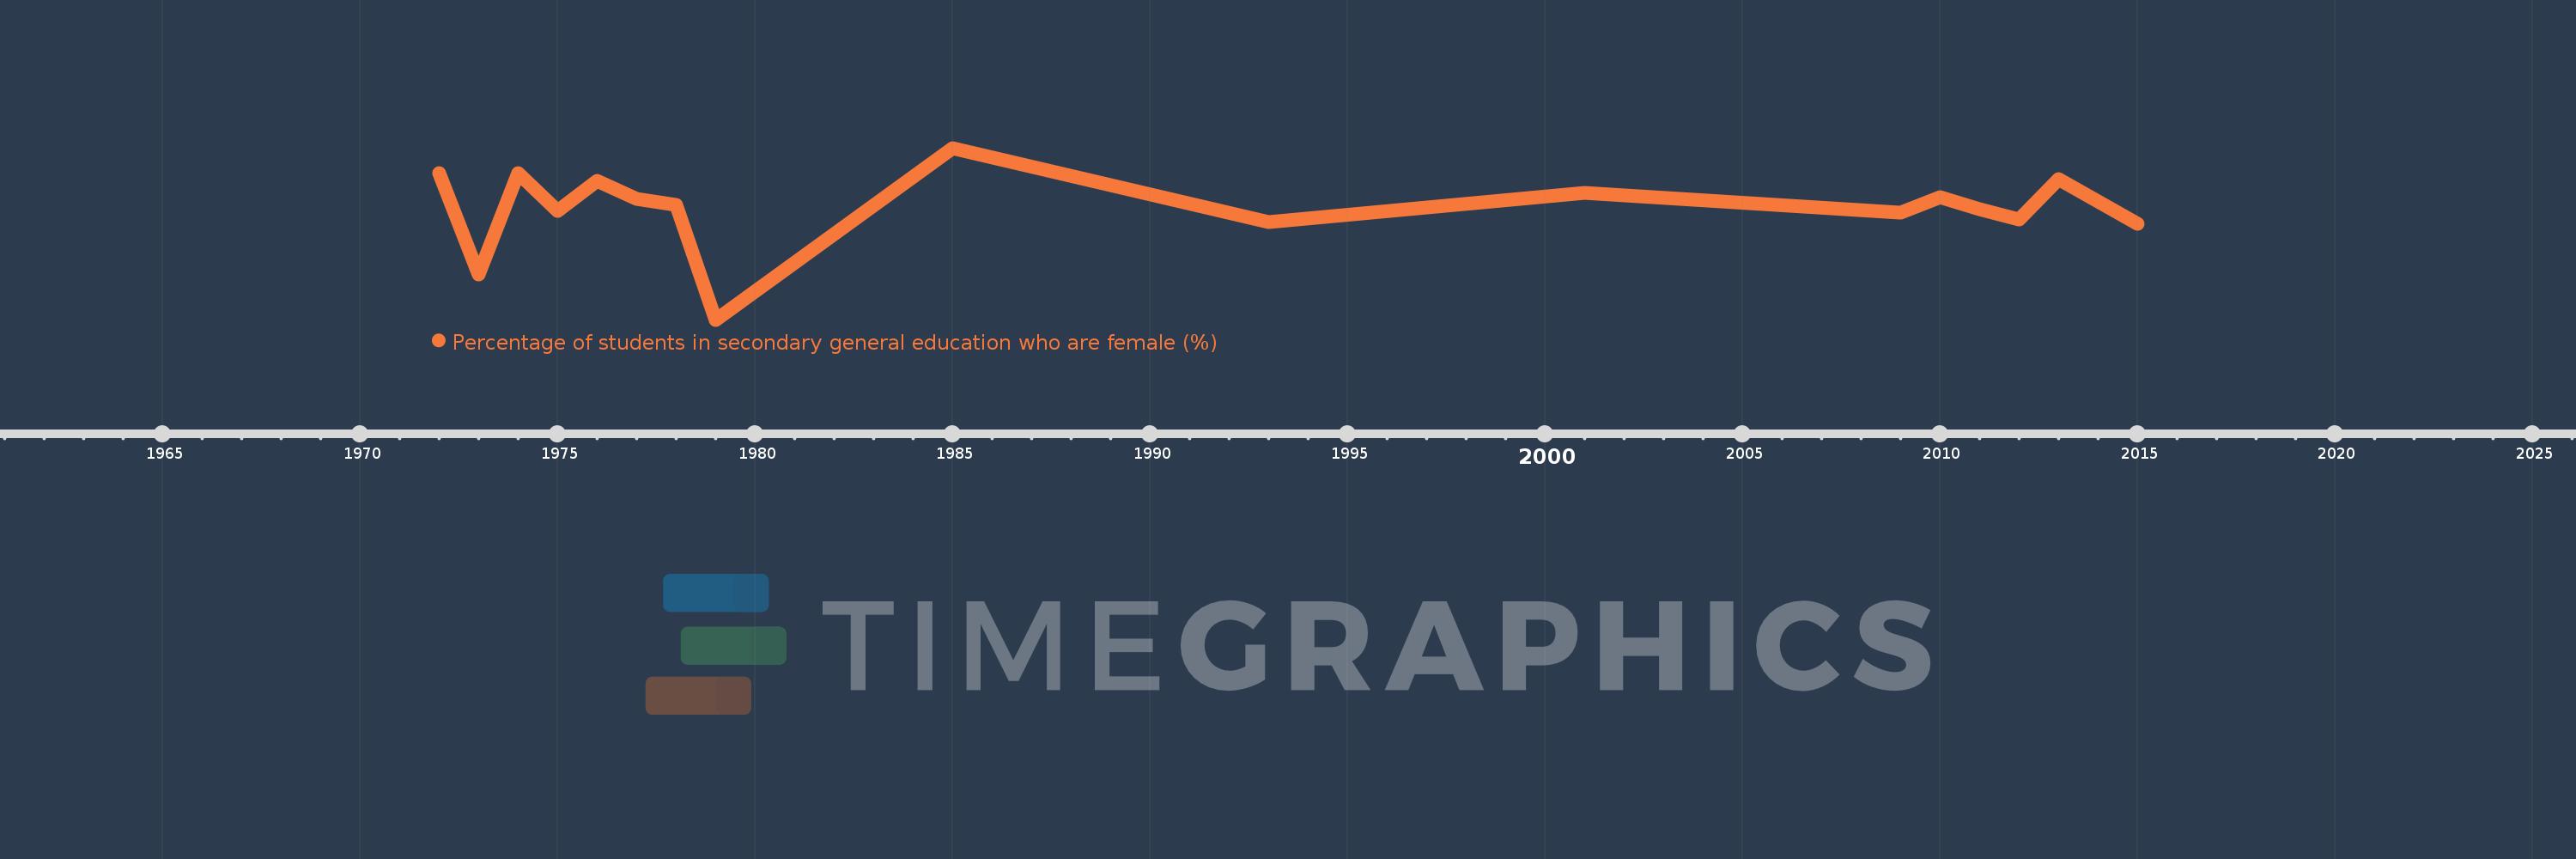
Percentage of students in secondary general education who are female (%)
2015,2013,2012,2011,2010,2009,2001,1993,1985,1979,1978,1977,1976,1975,1974,1973,1972