33
/
AIzaSyB4mHJ5NPEv-XzF7P6NDYXjlkCWaeKw5bc
November 30, 2025
68249
Angola
AGO
true
2
1
PPG, IDA (DIS, current US$)
2016,2015,2014,2013,2012,2011,2010,2009,2008,2007,2006,2005,2004,2003,2002,2001,2000,1999,1998,1997,1996,1995,1994,1993
Create a timeline
Public Timelines
For education
For educational institutions
For teachers
For students
Cabinet
For educational institutions
For teachers
For students
Open cabinet
FAQ
Close
Create a timeline
Public timelines
FAQ
About & Feedback
Terms
Privacy
FAQ
Support 24/7
Cabinet
Get premium
Donate
Download
Global statistics library
→
Angola
→
PPG, IDA (DIS, current US$)
This statistics in other country:
Afghanistan
Albania
Angola
Armenia
Azerbaijan
Bangladesh
Benin
Bhutan
Bolivia
Bosnia and Herzegovina
Botswana
Burkina Faso
Burundi
Cabo Verde
Cambodia
Cameroon
Central African Republic
Chad
China
Colombia
Comoros
Congo, Dem. Rep.
Congo, Rep.
Costa Rica
Cote d'Ivoire
Djibouti
Dominica
Dominican Republic
East Asia & Pacific (excluding high income)
Ecuador
Egypt, Arab Rep.
El Salvador
Eritrea
Ethiopia
Europe & Central Asia (excluding high income)
Gambia, The
Georgia
Ghana
Grenada
Guinea
Guinea-Bissau
Guyana
Haiti
Honduras
IDA only
India
Indonesia
Jordan
Kenya
Kosovo
Kyrgyz Republic
Lao PDR
Latin America & Caribbean (excluding high income)
Lesotho
Liberia
Low & middle income
Low income
Lower middle income
Macedonia, FYR
Madagascar
Malawi
Maldives
Mali
Mauritania
Mauritius
Middle East & North Africa (excluding high income)
Middle income
Moldova
Mongolia
Montenegro
Morocco
Mozambique
Myanmar
Nepal
Nicaragua
Niger
Nigeria
Pakistan
Papua New Guinea
Paraguay
Philippines
Rwanda
Samoa
Sao Tome and Principe
Senegal
Serbia
Sierra Leone
Solomon Islands
Somalia
South Asia
Sri Lanka
St. Lucia
St. Vincent and the Grenadines
Sub-Saharan Africa (excluding high income)
Sudan
Swaziland
Syrian Arab Republic
Tajikistan
Tanzania
Thailand
Togo
Tonga
Tunisia
Turkey
Uganda
Upper middle income
Uzbekistan
Vanuatu
Vietnam
Yemen, Rep.
Zambia
Zimbabwe
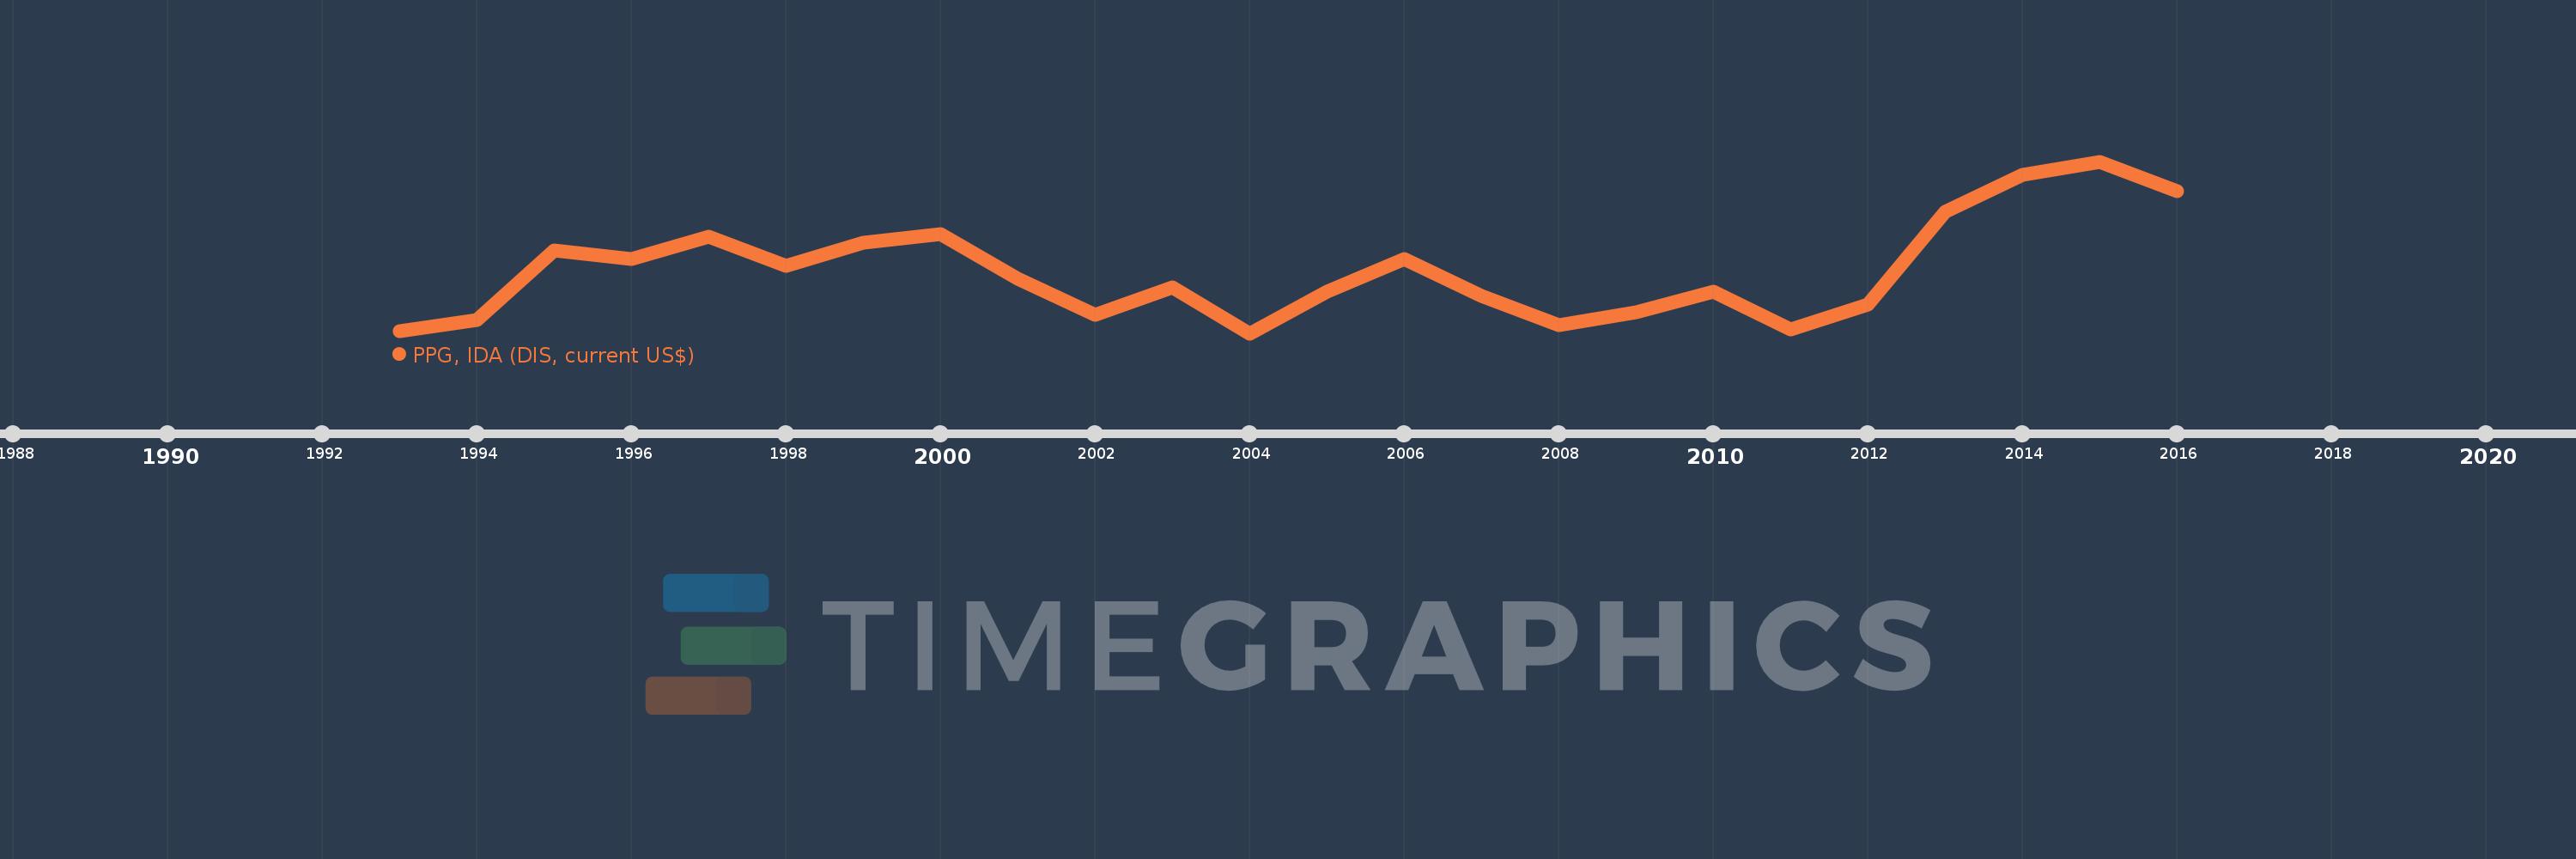
Timeline:
This timeline shows a graph from
1993
to
2016
of Angola. No data until
1992
. Number of actual observations by date:
24
.
Source name:
World Development Indicators
Source organization:
World Bank, International Debt Statistics.
Categories, topics:
External Debt
Last updated:
apr 23, 2017
Indicators value changes by year
Meaning:
26.23 mln
Minimum:
5.032 mln
jan 1, 2004
Maximum:
63.412 mln
jan 1, 2015
At the date of observation
Value
Absolute change
Change from the previous value
jan 1, 1993
5.729 mln
+5.729 mln
0.0%
jan 1, 1994
9.674 mln
+3.945 mln
68.86%
jan 1, 1995
33.325 mln
+23.651 mln
244.48%
jan 1, 1996
30.313 mln
-3.012 mln
-9.04%
jan 1, 1997
37.752 mln
+7.439 mln
24.54%
jan 1, 1998
27.887 mln
-9.865 mln
-26.13%
jan 1, 1999
35.764 mln
+7.877 mln
28.25%
jan 1, 2000
38.839 mln
+3.075 mln
8.6%
jan 1, 2001
23.71 mln
-15.129 mln
-38.95%
jan 1, 2002
11.453 mln
-12.257 mln
-51.7%
jan 1, 2003
20.624 mln
+9.171 mln
80.08%
jan 1, 2004
5.032 mln
-15.592 mln
-75.6%
jan 1, 2005
19.058 mln
+14.026 mln
278.74%
jan 1, 2006
30.211 mln
+11.153 mln
58.52%
jan 1, 2007
17.783 mln
-12.428 mln
-41.14%
jan 1, 2008
7.685 mln
-10.098 mln
-56.78%
jan 1, 2009
12.074 mln
+4.389 mln
57.11%
jan 1, 2010
19.188 mln
+7.114 mln
58.92%
jan 1, 2011
6.329 mln
-12.859 mln
-67.02%
jan 1, 2012
14.871 mln
+8.542 mln
134.97%
jan 1, 2013
46.373 mln
+31.502 mln
211.84%
jan 1, 2014
59.031 mln
+12.658 mln
27.3%
jan 1, 2015
63.412 mln
+4.381 mln
7.42%
jan 1, 2016
53.401 mln
-10.011 mln
-15.79%
Ranking of countries by current statistics by years
About & Feedback
Terms
Privacy
FAQ
Support 24/7
Cabinet
Get premium
Donate
The service accepts bank transfer (ACH, Wire) or cards (Visa, MasterCard, etc). Processed by Stripe.
Secured with SSL