33
/
AIzaSyB4mHJ5NPEv-XzF7P6NDYXjlkCWaeKw5bc
November 30, 2025
66525
Algeria
DZA
true
2
1
PPG, bonds (AMT, current US$)
1996,1995,1994,1993,1992,1991,1990,1989,1988,1987,1986,1985,1984,1983,1982,1981,1980,1979,1978,1975,1974,1973
Create a timeline
Public Timelines
For education
For educational institutions
For teachers
For students
Cabinet
For educational institutions
For teachers
For students
Open cabinet
FAQ
Close
Create a timeline
Public timelines
FAQ
About & Feedback
Terms
Privacy
FAQ
Support 24/7
Cabinet
Get premium
Donate
Download
Global statistics library
→
Algeria
→
PPG, bonds (AMT, current US$)
This statistics in other country:
Albania
Algeria
Angola
Argentina
Armenia
Azerbaijan
Belarus
Belize
Benin
Bolivia
Bosnia and Herzegovina
Botswana
Brazil
Bulgaria
Burkina Faso
Cameroon
China
Colombia
Congo, Dem. Rep.
Congo, Rep.
Costa Rica
Cote d'Ivoire
Dominica
Dominican Republic
East Asia & Pacific (excluding high income)
Ecuador
Egypt, Arab Rep.
El Salvador
Ethiopia
Europe & Central Asia (excluding high income)
Fiji
Gabon
Georgia
Ghana
Grenada
Guatemala
Guinea
Guyana
Honduras
IDA only
India
Indonesia
Jamaica
Jordan
Kazakhstan
Kenya
Lao PDR
Latin America & Caribbean (excluding high income)
Lebanon
Low & middle income
Low income
Lower middle income
Macedonia, FYR
Malawi
Malaysia
Mauritania
Mauritius
Mexico
Middle East & North Africa (excluding high income)
Middle income
Moldova
Mongolia
Montenegro
Morocco
Mozambique
Nicaragua
Niger
Nigeria
Pakistan
Panama
Papua New Guinea
Paraguay
Peru
Philippines
Romania
Russian Federation
Rwanda
Samoa
Senegal
Serbia
Sierra Leone
South Africa
South Asia
Sri Lanka
St. Lucia
St. Vincent and the Grenadines
Sub-Saharan Africa (excluding high income)
Sudan
Thailand
Togo
Tunisia
Turkey
Uganda
Ukraine
Upper middle income
Venezuela, RB
Vietnam
Zambia
Zimbabwe
Timeline:
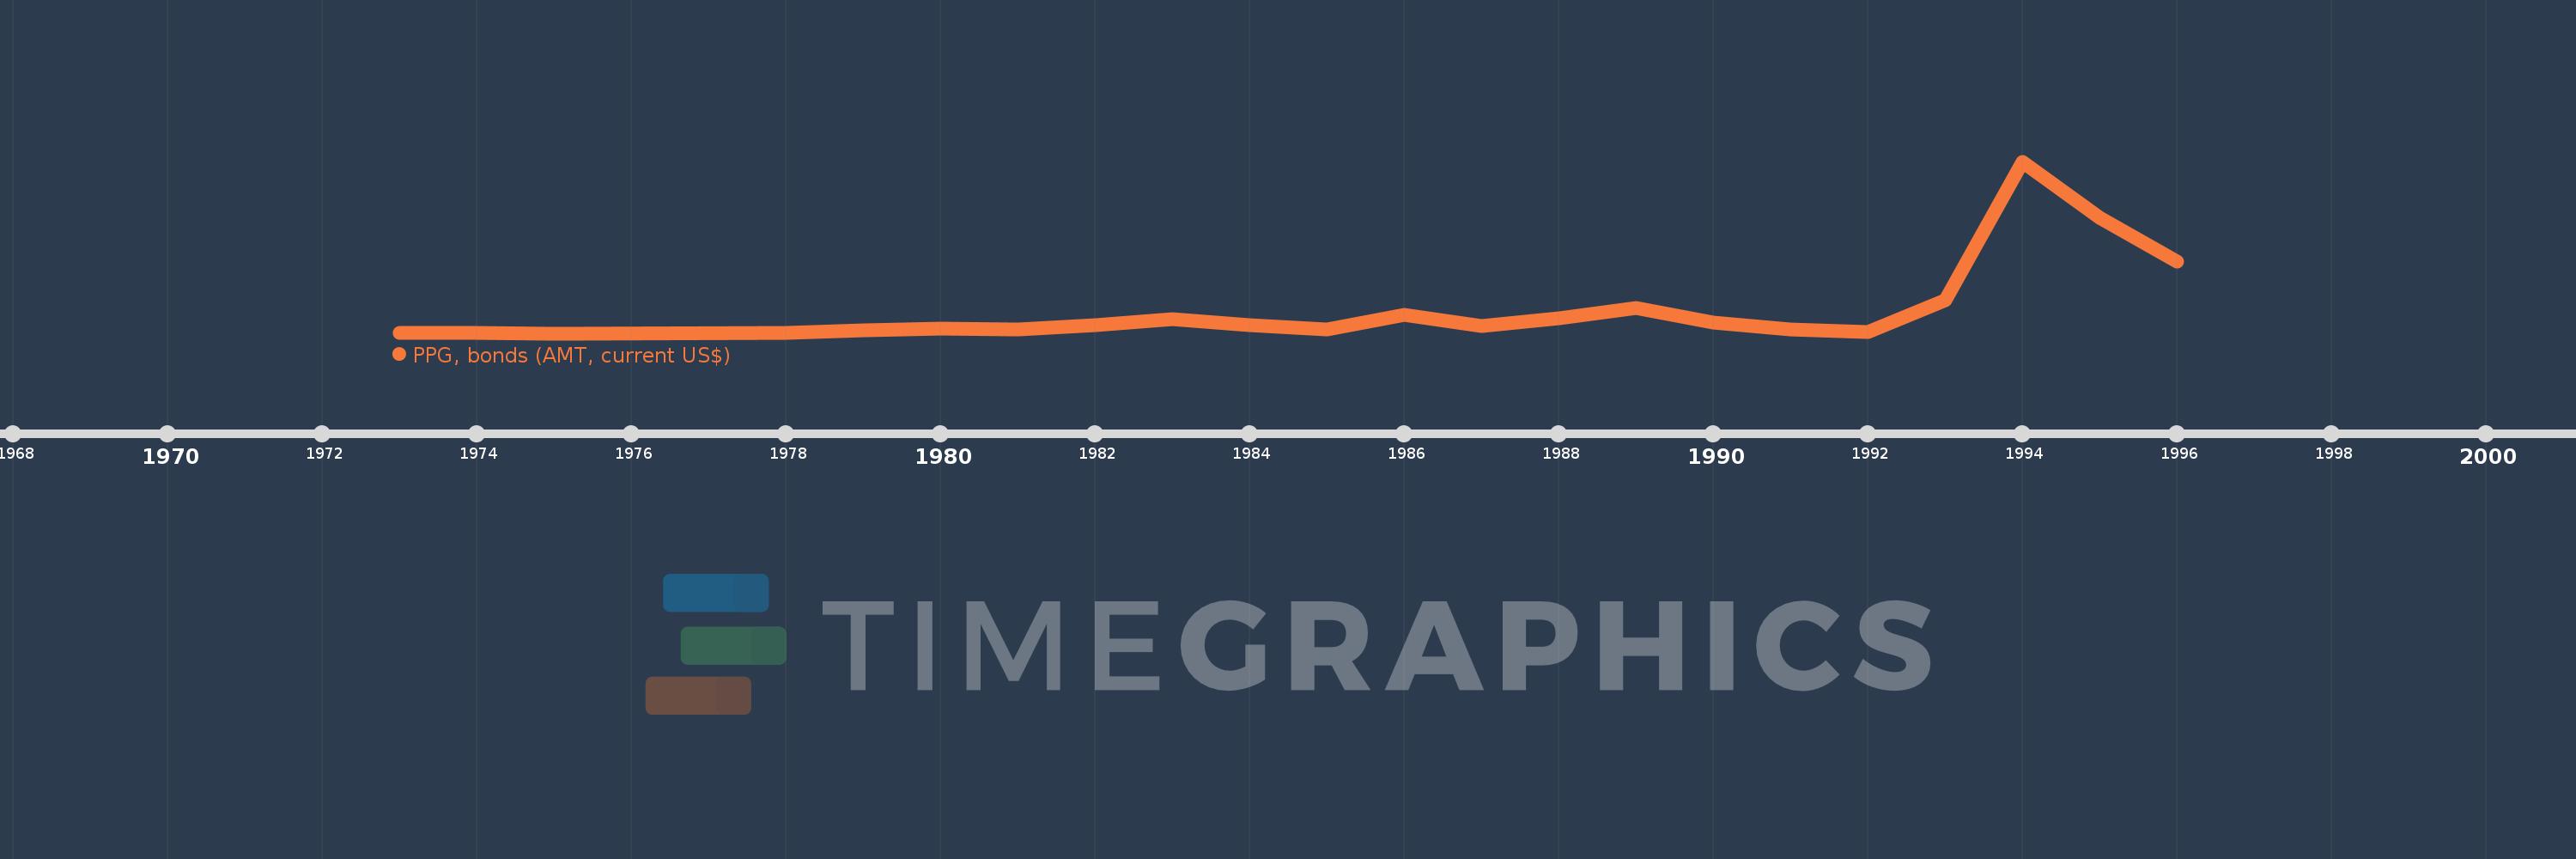
This timeline shows a graph from
1973
to
1996
of Algeria. No data until
1972
. Number of actual observations by date:
22
.
Source name:
World Development Indicators
Source organization:
World Bank, International Debt Statistics.
Categories, topics:
External Debt
Last updated:
apr 23, 2017
Indicators value changes by year
Meaning:
91.759 mln
Minimum:
460.0K
jan 1, 1975
Maximum:
662.954 mln
jan 1, 1994
At the date of observation
Value
Absolute change
Change from the previous value
jan 1, 1973
2.269 mln
+2.269 mln
0.0%
jan 1, 1974
2.686 mln
+417.0K
18.38%
jan 1, 1975
460.0K
-2.226 mln
-82.87%
jan 1, 1978
3.338 mln
+2.878 mln
625.65%
jan 1, 1979
12.759 mln
+9.421 mln
282.23%
jan 1, 1980
17.985 mln
+5.226 mln
40.96%
jan 1, 1981
14.591 mln
-3.394 mln
-18.87%
jan 1, 1982
30.535 mln
+15.944 mln
109.27%
jan 1, 1983
56.403 mln
+25.868 mln
84.72%
jan 1, 1984
32.84 mln
-23.563 mln
-41.78%
jan 1, 1985
14.631 mln
-18.209 mln
-55.45%
jan 1, 1986
70.845 mln
+56.214 mln
384.21%
jan 1, 1987
27.49 mln
-43.355 mln
-61.2%
jan 1, 1988
58.282 mln
+30.792 mln
112.01%
jan 1, 1989
97.805 mln
+39.523 mln
67.81%
jan 1, 1990
40.262 mln
-57.543 mln
-58.83%
jan 1, 1991
15.635 mln
-24.627 mln
-61.17%
jan 1, 1992
4.918 mln
-10.717 mln
-68.54%
jan 1, 1993
129.389 mln
+124.471 mln
2.53K%
jan 1, 1994
662.954 mln
+533.565 mln
412.37%
jan 1, 1995
444.522 mln
-218.432 mln
-32.95%
jan 1, 1996
278.103 mln
-166.419 mln
-37.44%
Ranking of countries by current statistics by years
About & Feedback
Terms
Privacy
FAQ
Support 24/7
Cabinet
Get premium
Donate
The service accepts bank transfer (ACH, Wire) or cards (Visa, MasterCard, etc). Processed by Stripe.
Secured with SSL