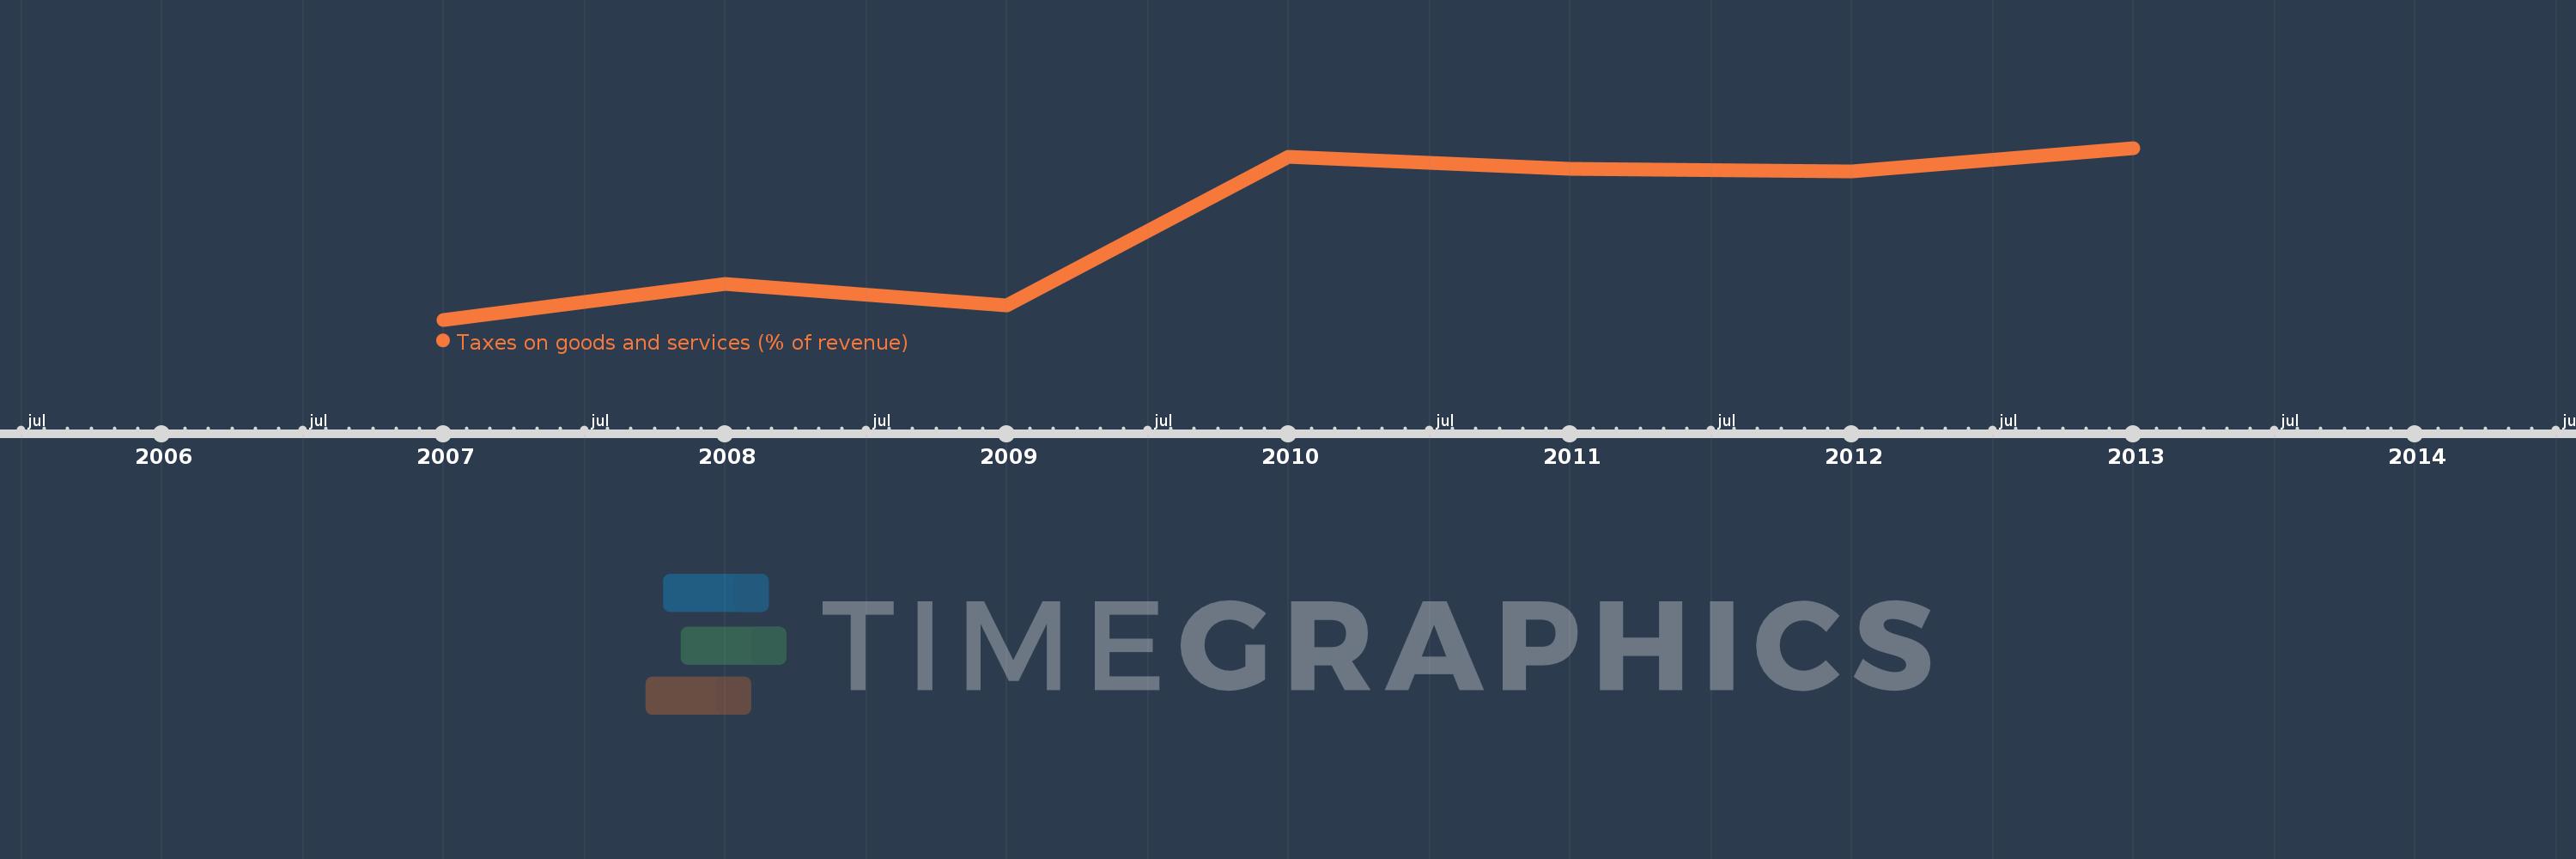
This timeline shows a graph from 2007 to 2013 of Sub-Saharan Africa (IDA & IBRD countries). No data until 2006. Number of actual observations by date: 7.
Source name:
World Development Indicators
Source organization:
International Monetary Fund, Government Finance Statistics Yearbook and data files.
Categories, topics:
Public Sector
Last updated:
apr 23, 2017
Indicators value changes by year
Meaning:
24.056
Minimum:
17.73
jan 1, 2007
Maximum:
28.866
jan 1, 2013
At the date of observation
Value
Absolute change
Change from the previous value
jan 1, 2007
17.73
+17.73
0.0%
jan 1, 2008
20.064
+2.334
13.17%
jan 1, 2009
18.635
-1.43
-7.12%
jan 1, 2010
28.266
+9.631
51.68%
jan 1, 2011
27.506
-0.759
-2.69%
jan 1, 2012
27.326
-0.181
-0.66%
jan 1, 2013
28.866
+1.54
5.64%
Ranking of countries by current statistics by years