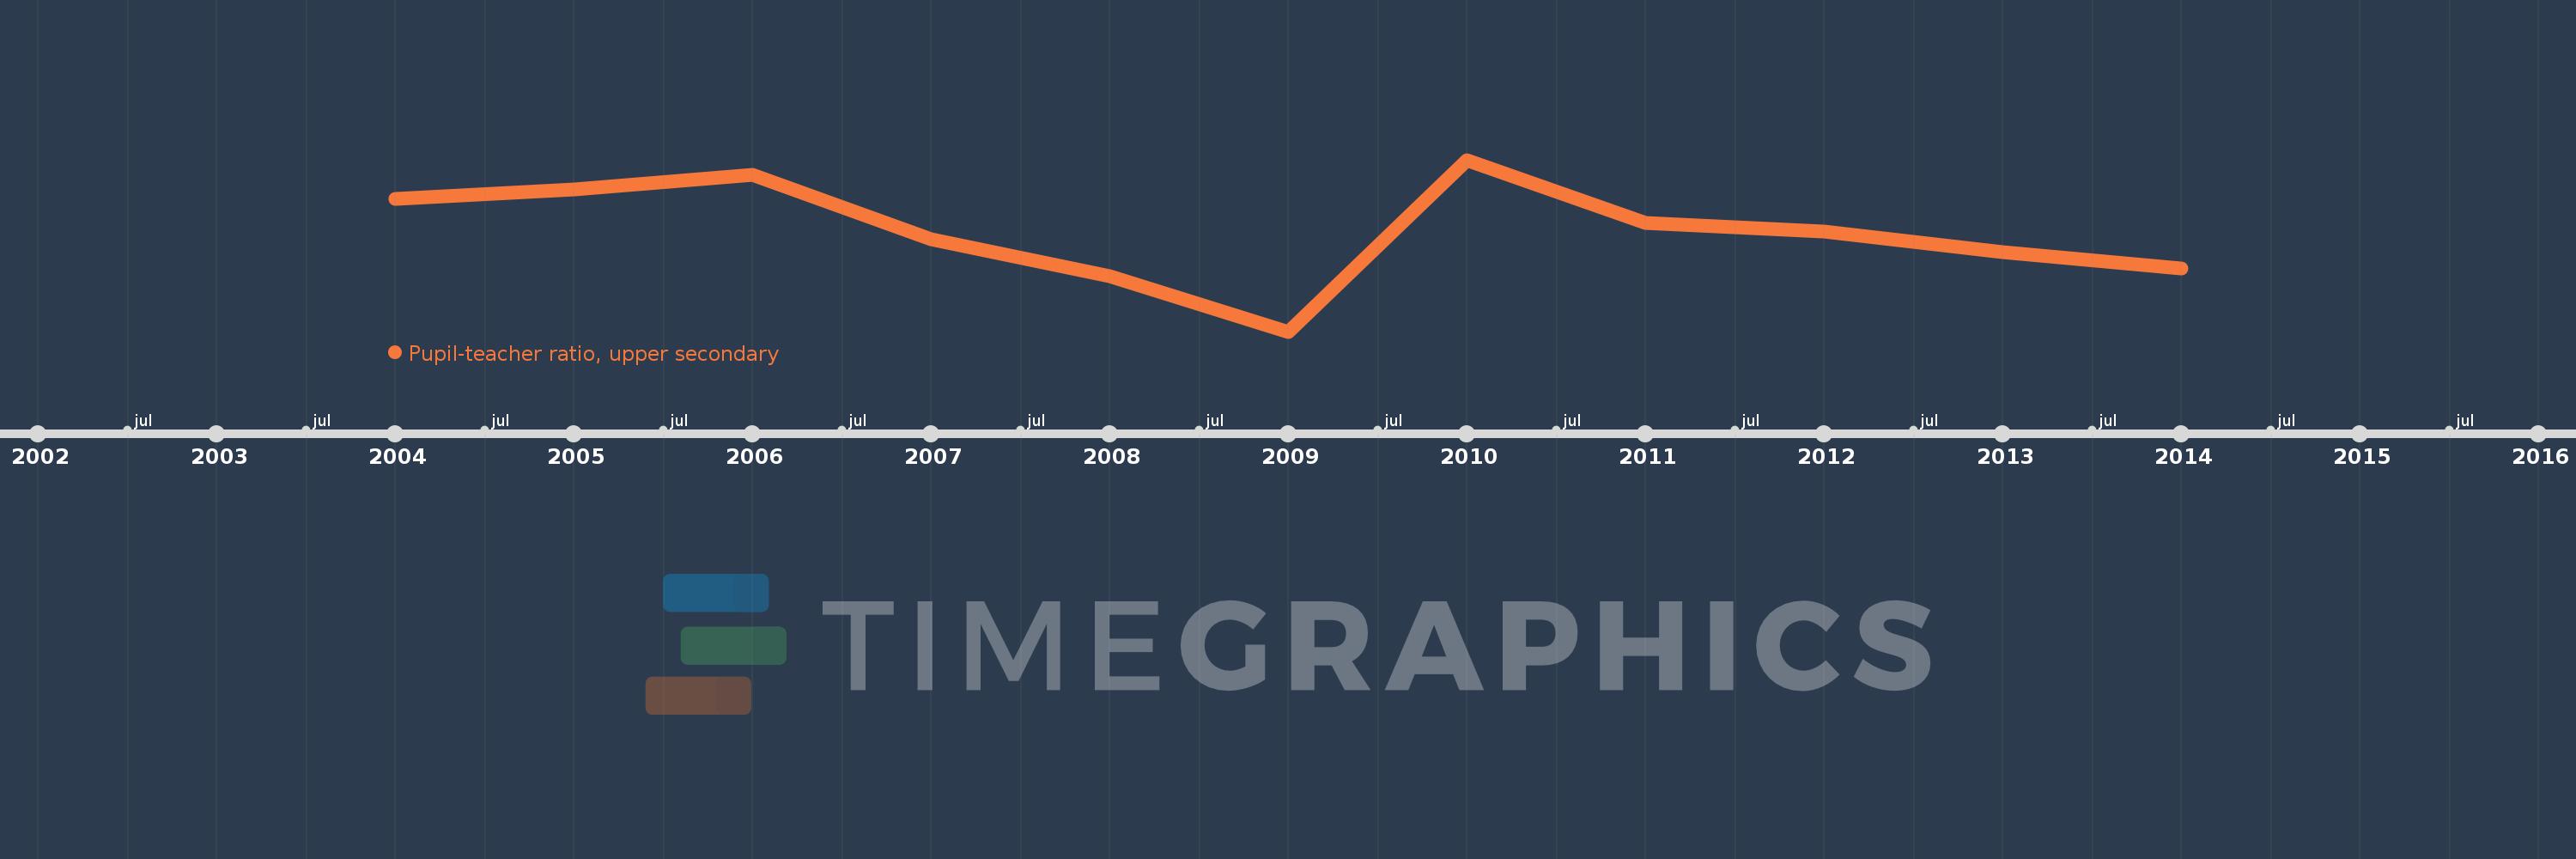
This timeline shows a graph from 2004 to 2014 of Sub-Saharan Africa (IDA & IBRD countries). No data until 2003. Number of actual observations by date: 11.
Source name:
World Development Indicators
Source organization:
United Nations Educational, Scientific, and Cultural Organization (UNESCO) Institute for Statistics.
Categories, topics:
Education
Last updated:
apr 23, 2017
Indicators value changes by year
Meaning:
22.792
Minimum:
20.435
jan 1, 2009
Maximum:
24.474
jan 1, 2010
At the date of observation
Value
Absolute change
Change from the previous value
jan 1, 2004
23.561
+23.561
0.0%
jan 1, 2005
23.784
+0.223
0.95%
jan 1, 2006
24.125
+0.342
1.44%
jan 1, 2007
22.604
-1.521
-6.31%
jan 1, 2008
21.74
-0.864
-3.82%
jan 1, 2009
20.435
-1.305
-6.0%
jan 1, 2010
24.474
+4.038
19.76%
jan 1, 2011
22.98
-1.494
-6.1%
jan 1, 2012
22.783
-0.197
-0.86%
jan 1, 2013
22.31
-0.473
-2.07%
jan 1, 2014
21.914
-0.396
-1.78%
Ranking of countries by current statistics by years