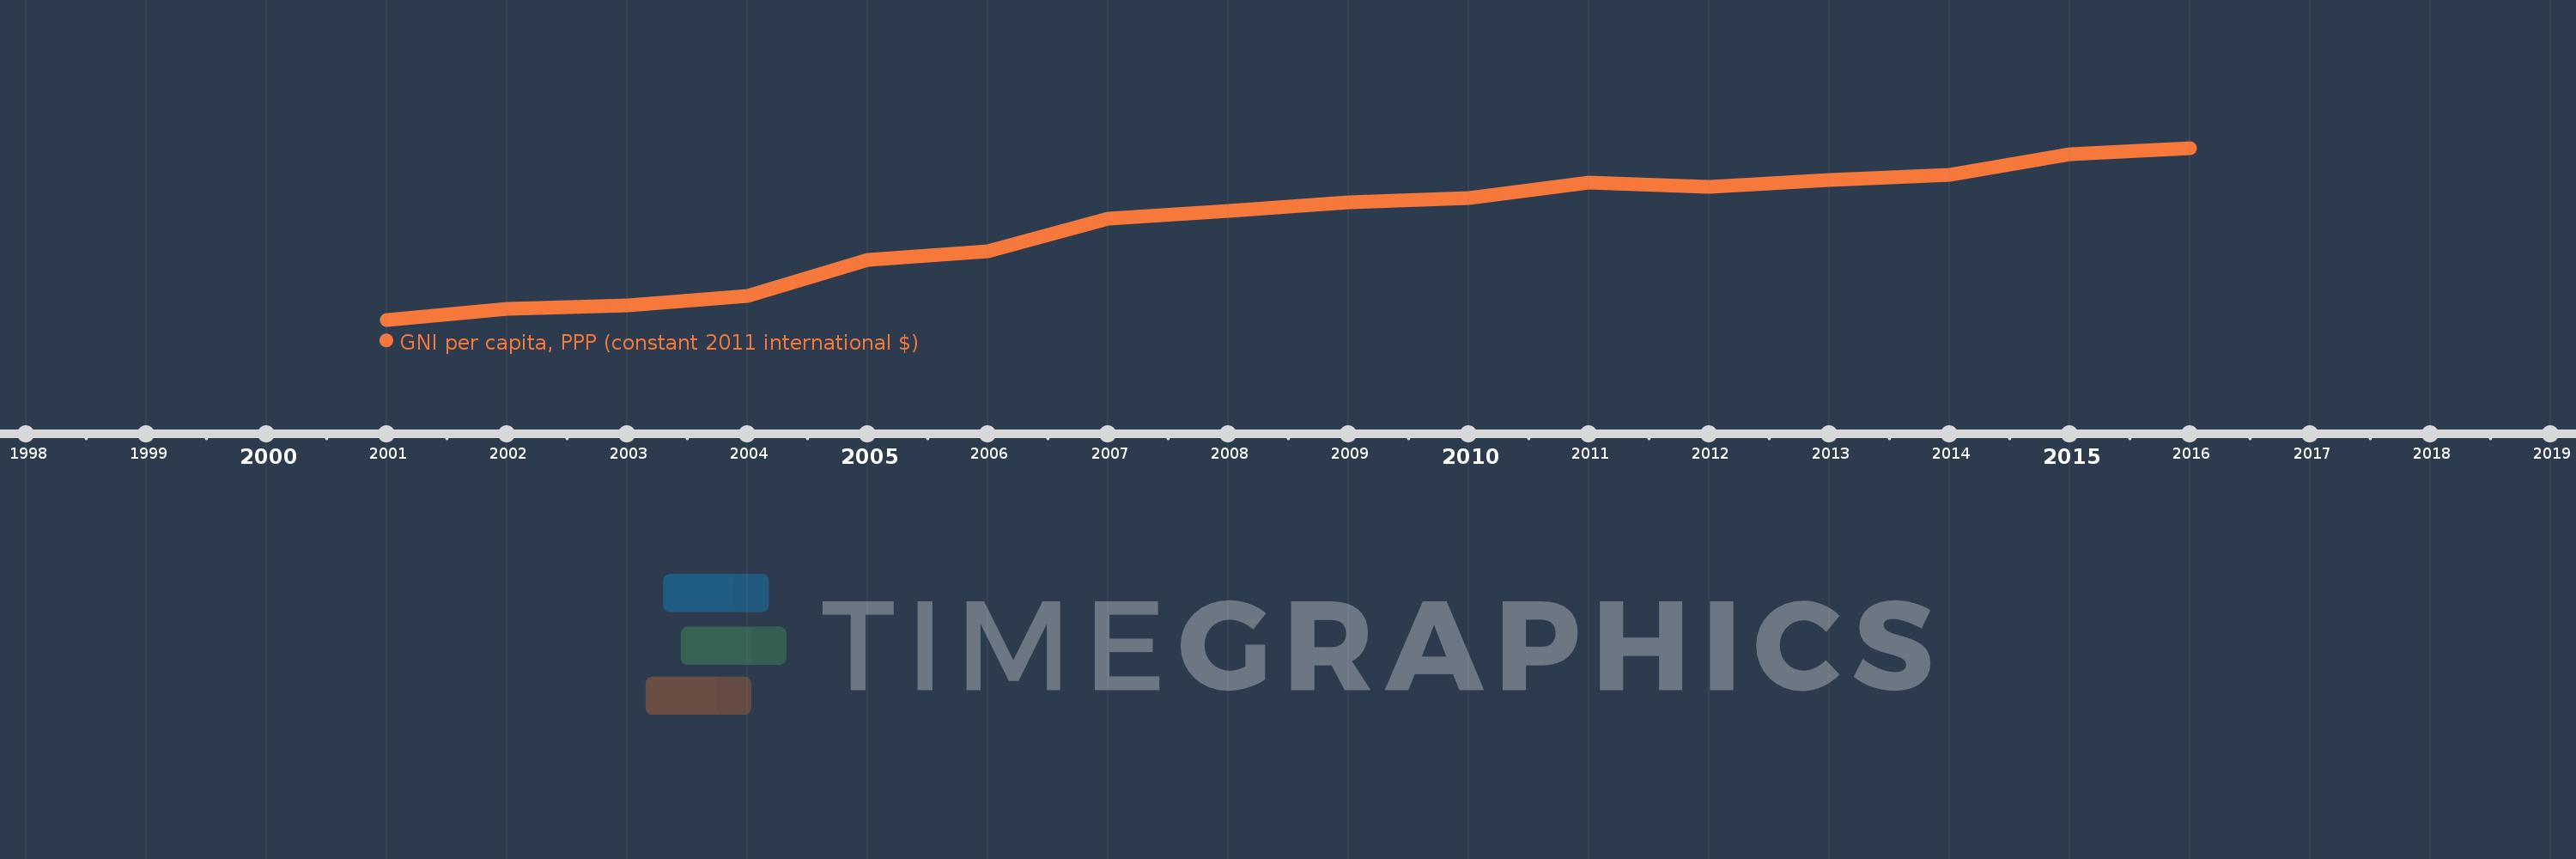
This timeline shows a graph from 2001 to 2016 of Sub-Saharan Africa (IDA & IBRD countries). No data until 2000. Number of actual observations by date: 16.
Source name:
World Development Indicators
Source organization:
World Bank, International Comparison Program database.
Categories, topics:
Economy & Growth
Last updated:
apr 23, 2017
Indicators value changes by year
Meaning:
2.905K
Minimum:
2.318K
jan 1, 2001
Maximum:
3.381K
jan 1, 2016
At the date of observation
Value
Absolute change
Change from the previous value
jan 1, 2001
2.318K
+2.318K
0.0%
jan 1, 2002
2.386K
+68.736
2.97%
jan 1, 2003
2.408K
+21.183
0.89%
jan 1, 2004
2.464K
+56.615
2.35%
jan 1, 2005
2.689K
+225.154
9.14%
jan 1, 2006
2.739K
+49.884
1.85%
jan 1, 2007
2.943K
+203.462
7.43%
jan 1, 2008
2.994K
+50.915
1.73%
jan 1, 2009
3.047K
+53.37
1.78%
jan 1, 2010
3.071K
+24.132
0.79%
jan 1, 2011
3.167K
+95.907
3.12%
jan 1, 2012
3.139K
-28.454
-0.9%
jan 1, 2013
3.185K
+46.061
1.47%
jan 1, 2014
3.212K
+27.57
0.87%
jan 1, 2015
3.344K
+131.815
4.1%
jan 1, 2016
3.381K
+37.016
1.11%
Ranking of countries by current statistics by years