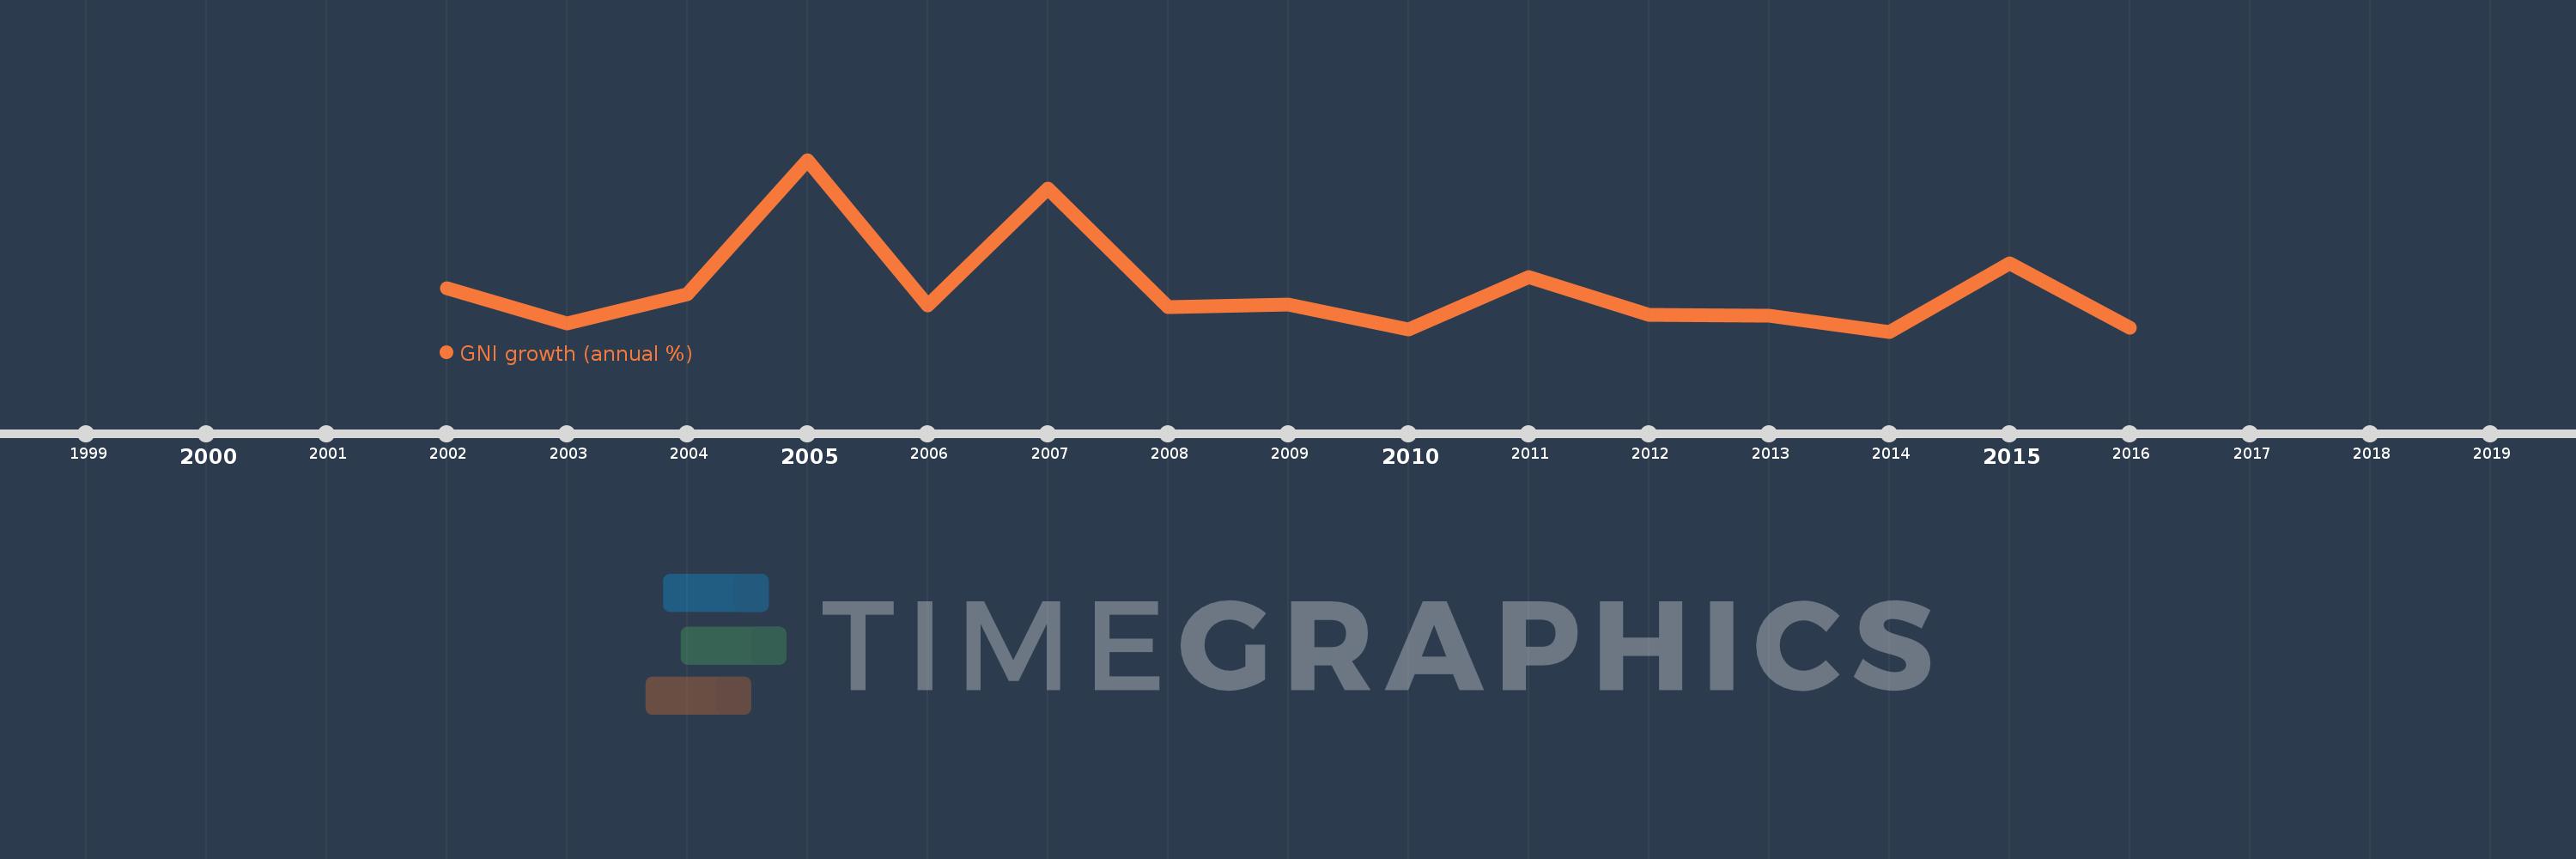
This timeline shows a graph from 2002 to 2016 of Sub-Saharan Africa (IDA & IBRD countries). No data until 2001. Number of actual observations by date: 15.
Source name:
World Development Indicators
Source organization:
World Bank national accounts data, and OECD National Accounts data files.
Categories, topics:
Economy & Growth
Last updated:
apr 23, 2017
Indicators value changes by year
Meaning:
5.252
Minimum:
3.267
jan 1, 2014
Maximum:
11.209
jan 1, 2005
At the date of observation
Value
Absolute change
Change from the previous value
jan 1, 2002
5.274
+5.274
0.0%
jan 1, 2003
3.654
-1.62
-30.71%
jan 1, 2004
5.01
+1.356
37.1%
jan 1, 2005
11.209
+6.199
123.72%
jan 1, 2006
4.491
-6.717
-59.93%
jan 1, 2007
9.866
+5.375
119.67%
jan 1, 2008
4.41
-5.456
-55.3%
jan 1, 2009
4.529
+0.119
2.69%
jan 1, 2010
3.381
-1.148
-25.34%
jan 1, 2011
5.776
+2.395
70.83%
jan 1, 2012
4.037
-1.739
-30.11%
jan 1, 2013
3.988
-0.048
-1.2%
jan 1, 2014
3.267
-0.722
-18.09%
jan 1, 2015
6.425
+3.158
96.68%
jan 1, 2016
3.459
-2.966
-46.17%
Ranking of countries by current statistics by years