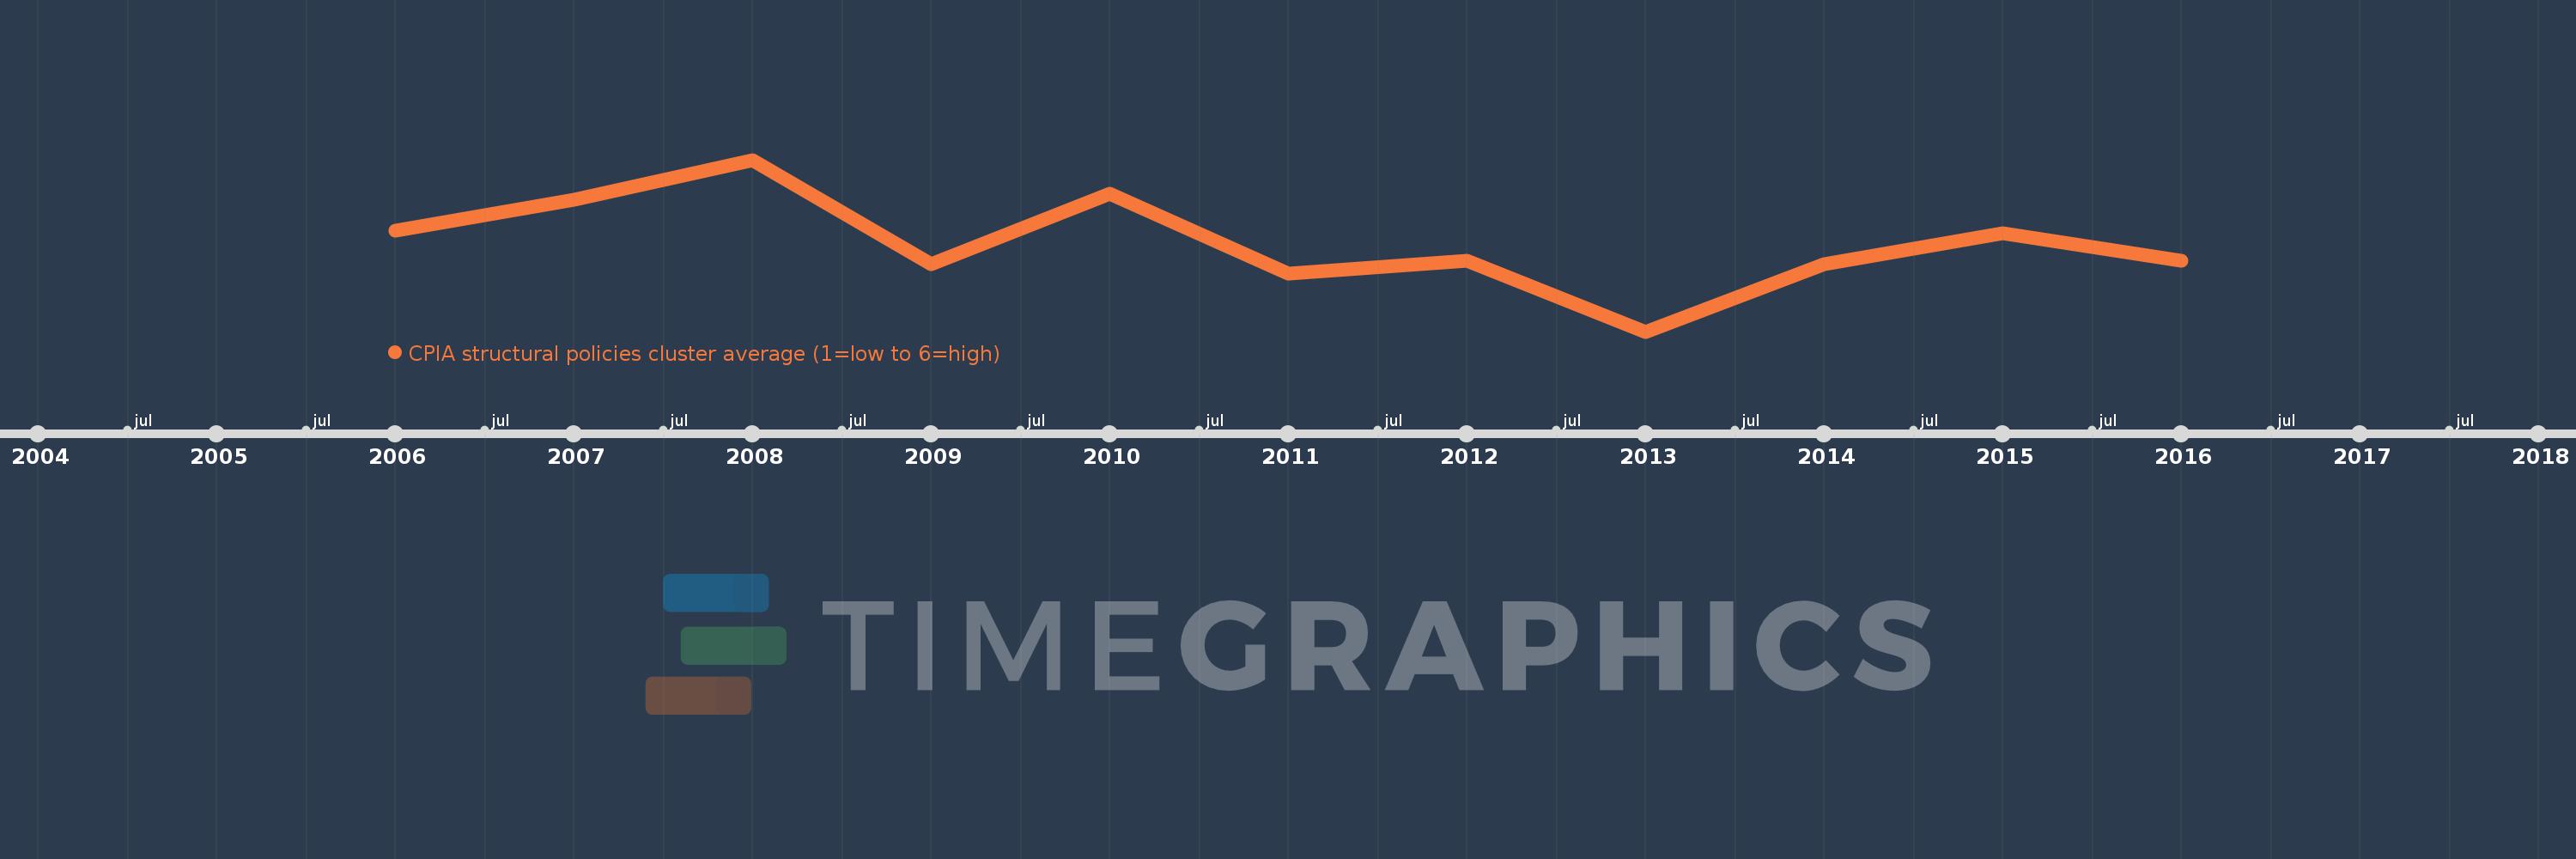
This timeline shows a graph from 2006 to 2016 of Sub-Saharan Africa (IDA & IBRD countries). No data until 2005. Number of actual observations by date: 11.
Source name:
World Development Indicators
Source organization:
World Bank Group, CPIA database (http://www.worldbank.org/ida).
Categories, topics:
Public Sector
Last updated:
apr 23, 2017
Indicators value changes by year
Meaning:
3.221
Minimum:
3.192
jan 1, 2013
Maximum:
3.248
jan 1, 2008
At the date of observation
Value
Absolute change
Change from the previous value
jan 1, 2006
3.225
+3.225
0.0%
jan 1, 2007
3.235
+0.01
0.31%
jan 1, 2008
3.248
+0.013
0.39%
jan 1, 2009
3.214
-0.034
-1.05%
jan 1, 2010
3.237
+0.023
0.73%
jan 1, 2011
3.211
-0.026
-0.81%
jan 1, 2012
3.215
+0.004
0.14%
jan 1, 2013
3.192
-0.023
-0.7%
jan 1, 2014
3.214
+0.021
0.67%
jan 1, 2015
3.224
+0.01
0.31%
jan 1, 2016
3.215
-0.009
-0.27%
Ranking of countries by current statistics by years