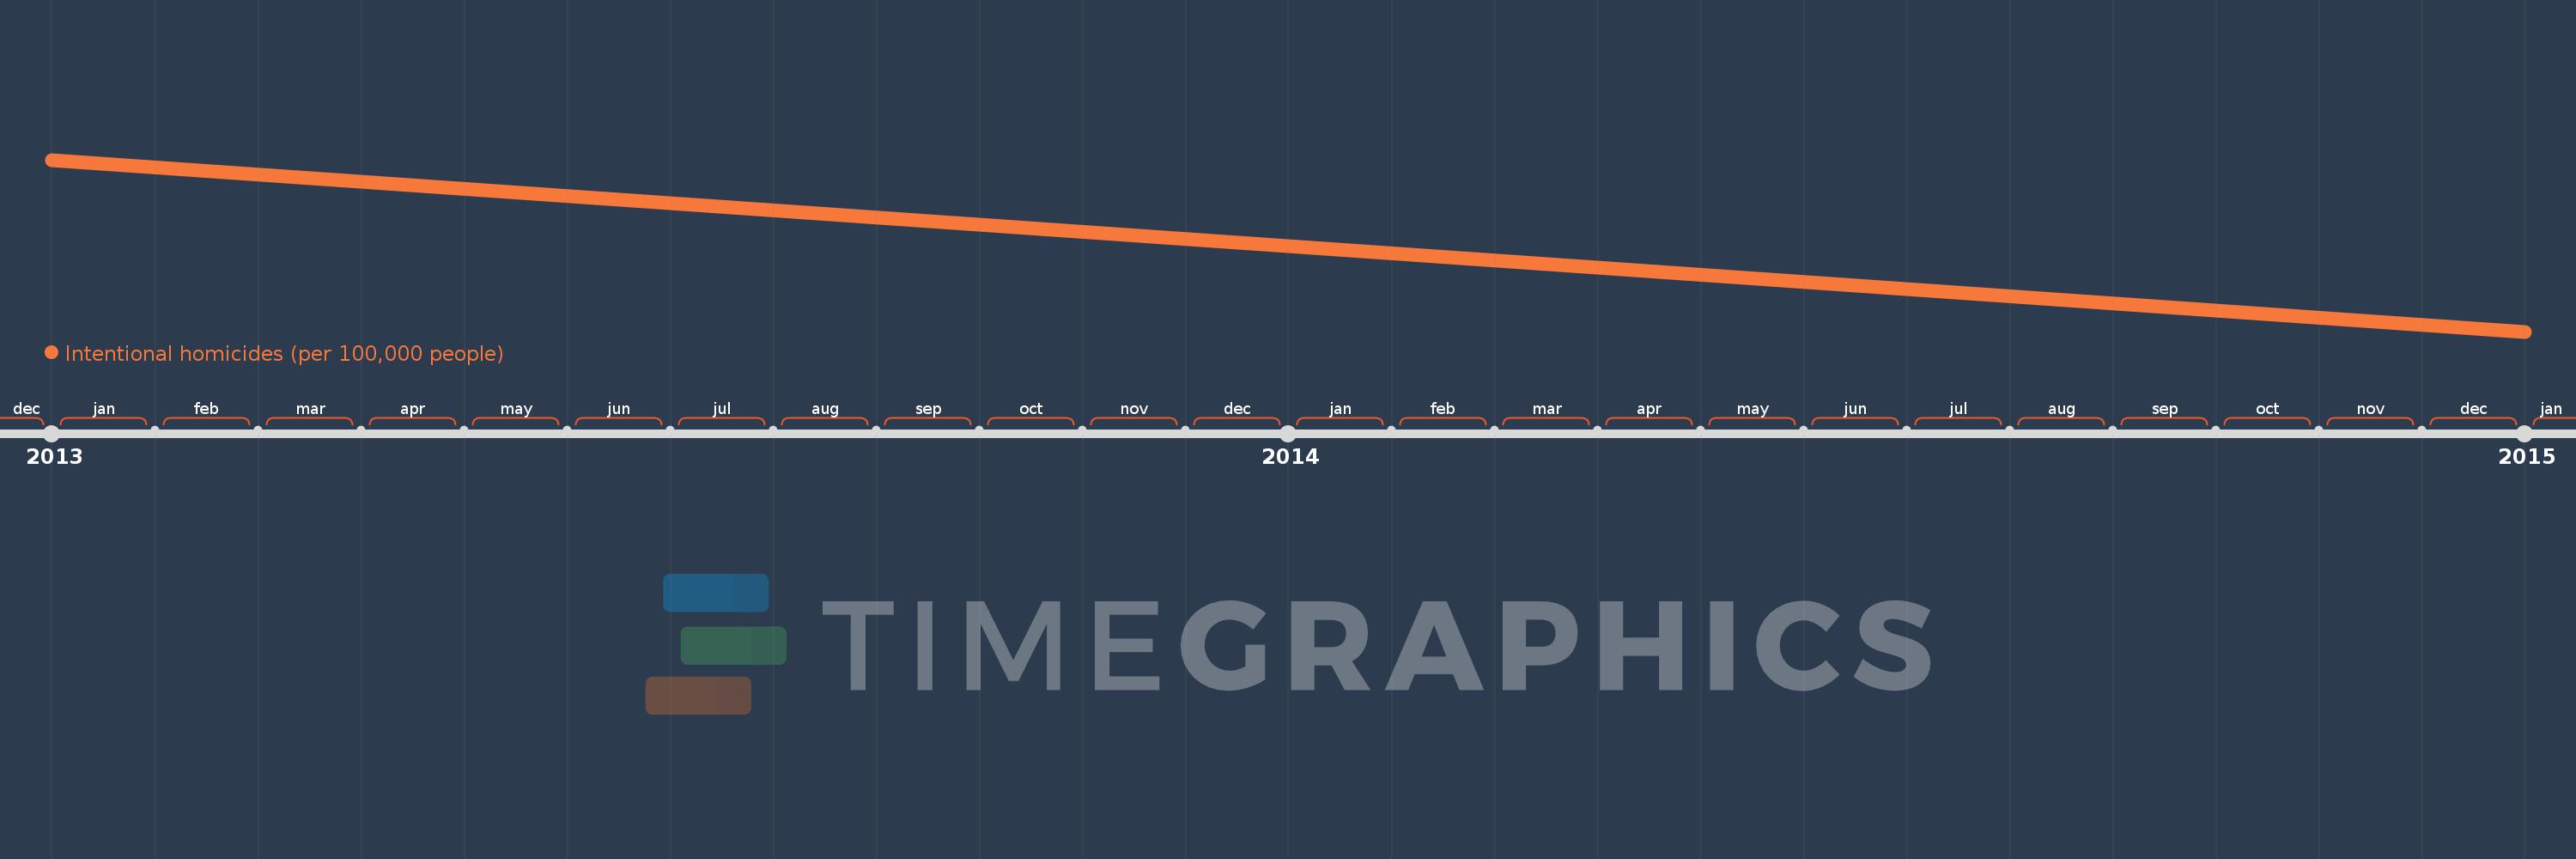
This timeline shows a graph from 2013 to 2015 of Sub-Saharan Africa (excluding high income). No data until 2012. Number of actual observations by date: 2.
Source name:
World Development Indicators
Source organization:
UN Office on Drugs and Crime's International Homicide Statistics database.
Categories, topics:
Public Sector
Last updated:
apr 23, 2017
Indicators value changes by year
Meaning:
11.95
Minimum:
9.5
jan 1, 2015
Maximum:
14.4
jan 1, 2013
At the date of observation
Value
Absolute change
Change from the previous value
jan 1, 2013
14.4
+14.4
0.0%
jan 1, 2015
9.5
-4.9
-34.03%
Ranking of countries by current statistics by years