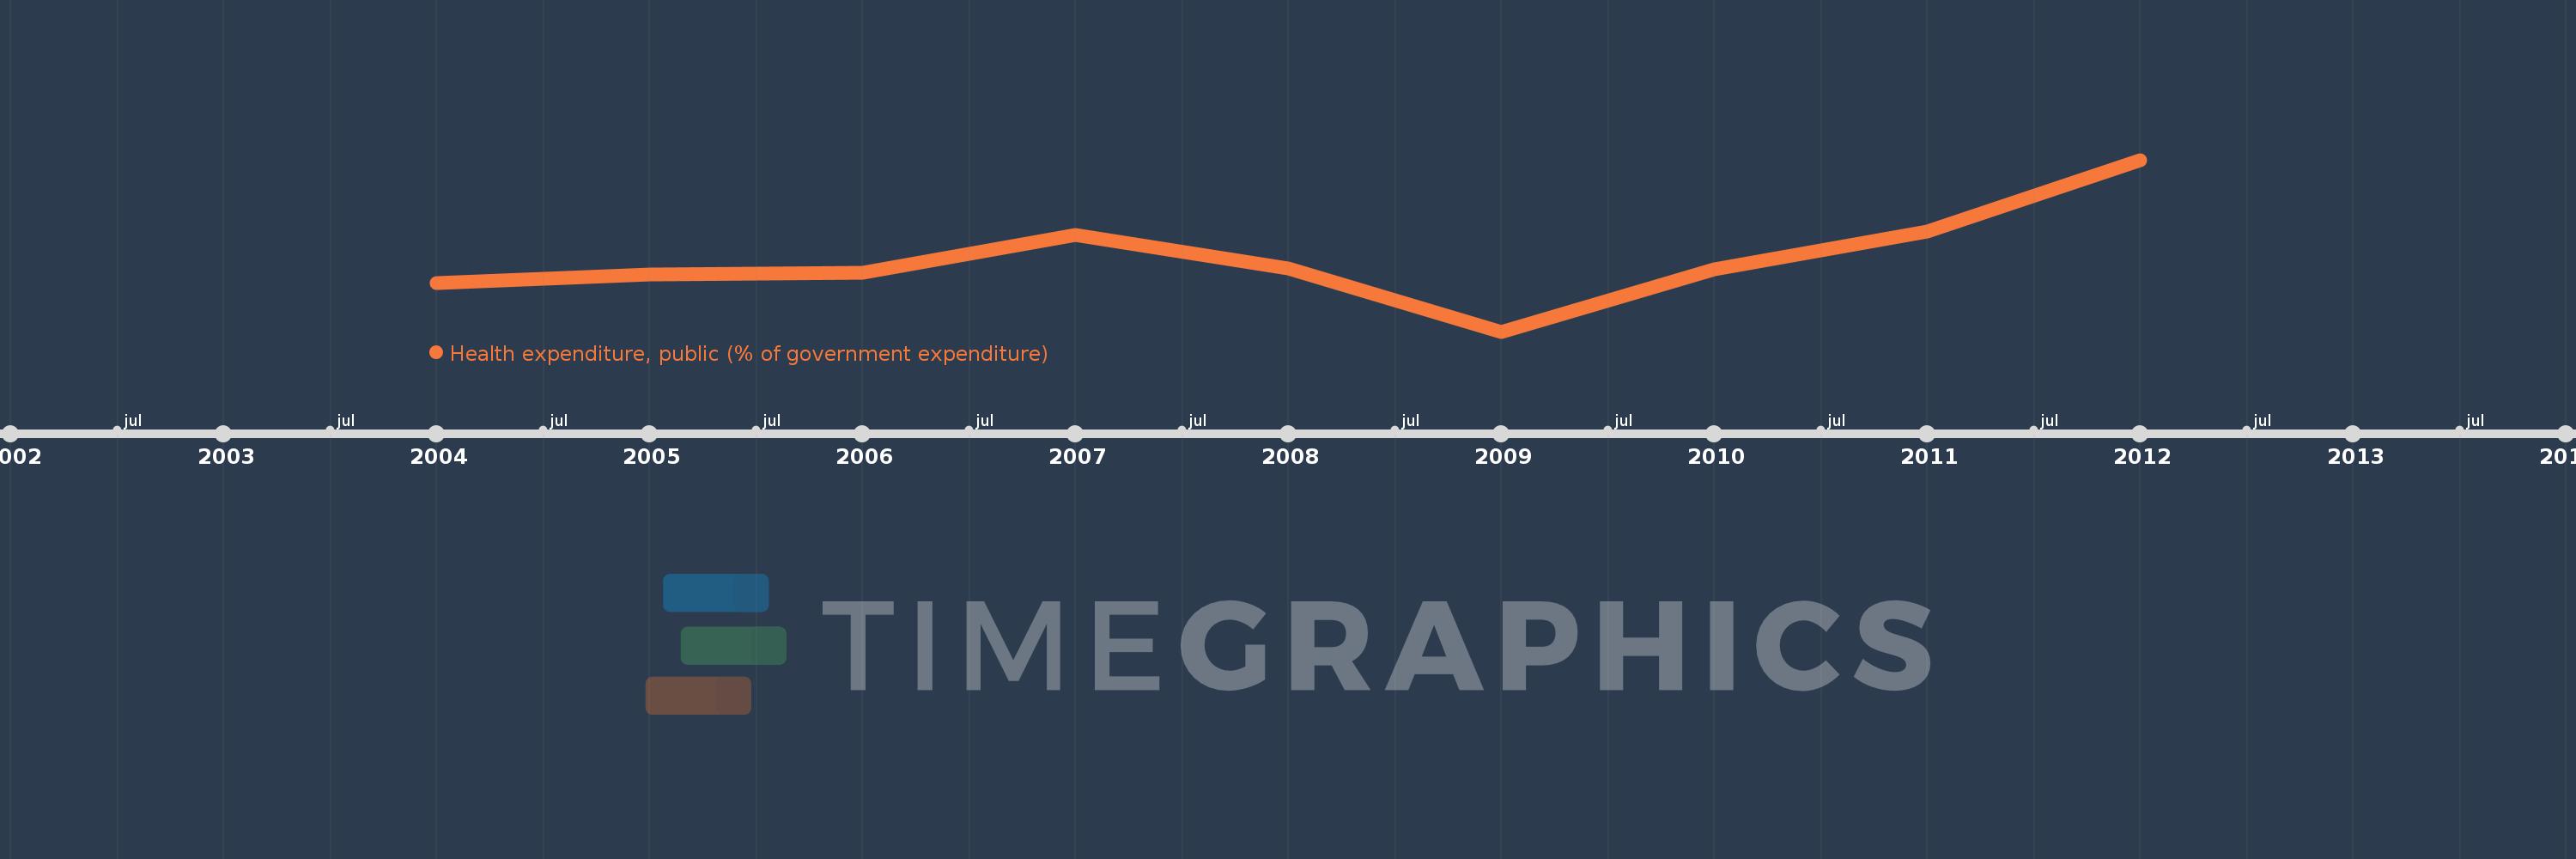
This timeline shows a graph from 2004 to 2012 of Sub-Saharan Africa (excluding high income). No data until 2003. Number of actual observations by date: 9.
Source name:
World Development Indicators
Source organization:
World Health Organization Global Health Expenditure database (see http://apps.who.int/nha/database for the most recent updates).
Categories, topics:
Health
Last updated:
apr 23, 2017
Indicators value changes by year
Meaning:
11.668
Minimum:
11.23
jan 1, 2009
Maximum:
12.259
jan 1, 2012
At the date of observation
Value
Absolute change
Change from the previous value
jan 1, 2004
11.522
+11.522
0.0%
jan 1, 2005
11.572
+0.051
0.44%
jan 1, 2006
11.581
+0.009
0.07%
jan 1, 2007
11.808
+0.227
1.96%
jan 1, 2008
11.607
-0.201
-1.7%
jan 1, 2009
11.23
-0.377
-3.25%
jan 1, 2010
11.601
+0.372
3.31%
jan 1, 2011
11.828
+0.227
1.95%
jan 1, 2012
12.259
+0.431
3.65%
Ranking of countries by current statistics by years