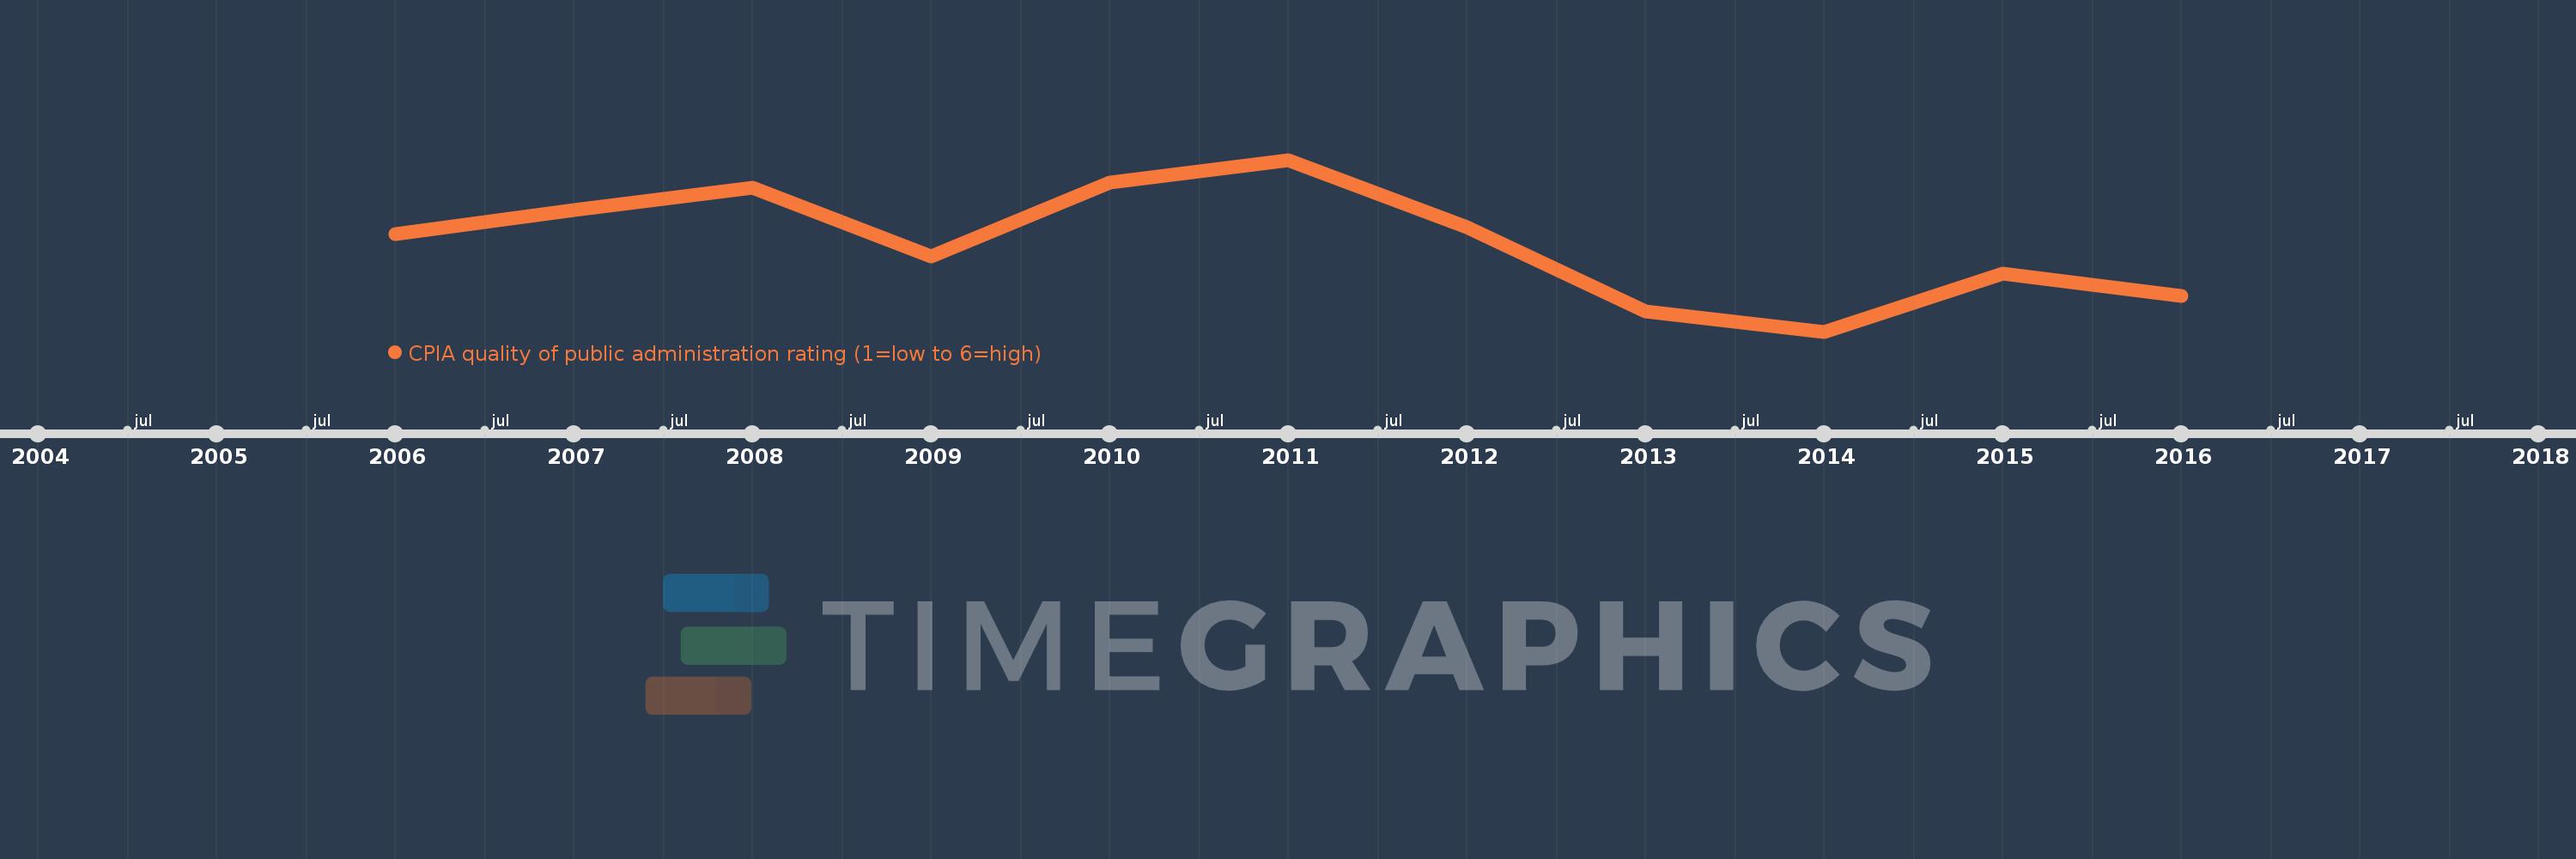
This timeline shows a graph from 2006 to 2016 of Sub-Saharan Africa (excluding high income). No data until 2005. Number of actual observations by date: 11.
Source name:
World Development Indicators
Source organization:
World Bank Group, CPIA database (http://www.worldbank.org/ida).
Categories, topics:
Public Sector
Last updated:
apr 23, 2017
Indicators value changes by year
Meaning:
2.873
Minimum:
2.821
jan 1, 2014
Maximum:
2.921
jan 1, 2011
At the date of observation
Value
Absolute change
Change from the previous value
jan 1, 2006
2.878
+2.878
0.0%
jan 1, 2007
2.892
+0.014
0.47%
jan 1, 2008
2.905
+0.014
0.47%
jan 1, 2009
2.865
-0.041
-1.4%
jan 1, 2010
2.908
+0.043
1.5%
jan 1, 2011
2.921
+0.013
0.45%
jan 1, 2012
2.882
-0.039
-1.35%
jan 1, 2013
2.833
-0.048
-1.67%
jan 1, 2014
2.821
-0.013
-0.45%
jan 1, 2015
2.855
+0.035
1.23%
jan 1, 2016
2.842
-0.013
-0.46%
Ranking of countries by current statistics by years