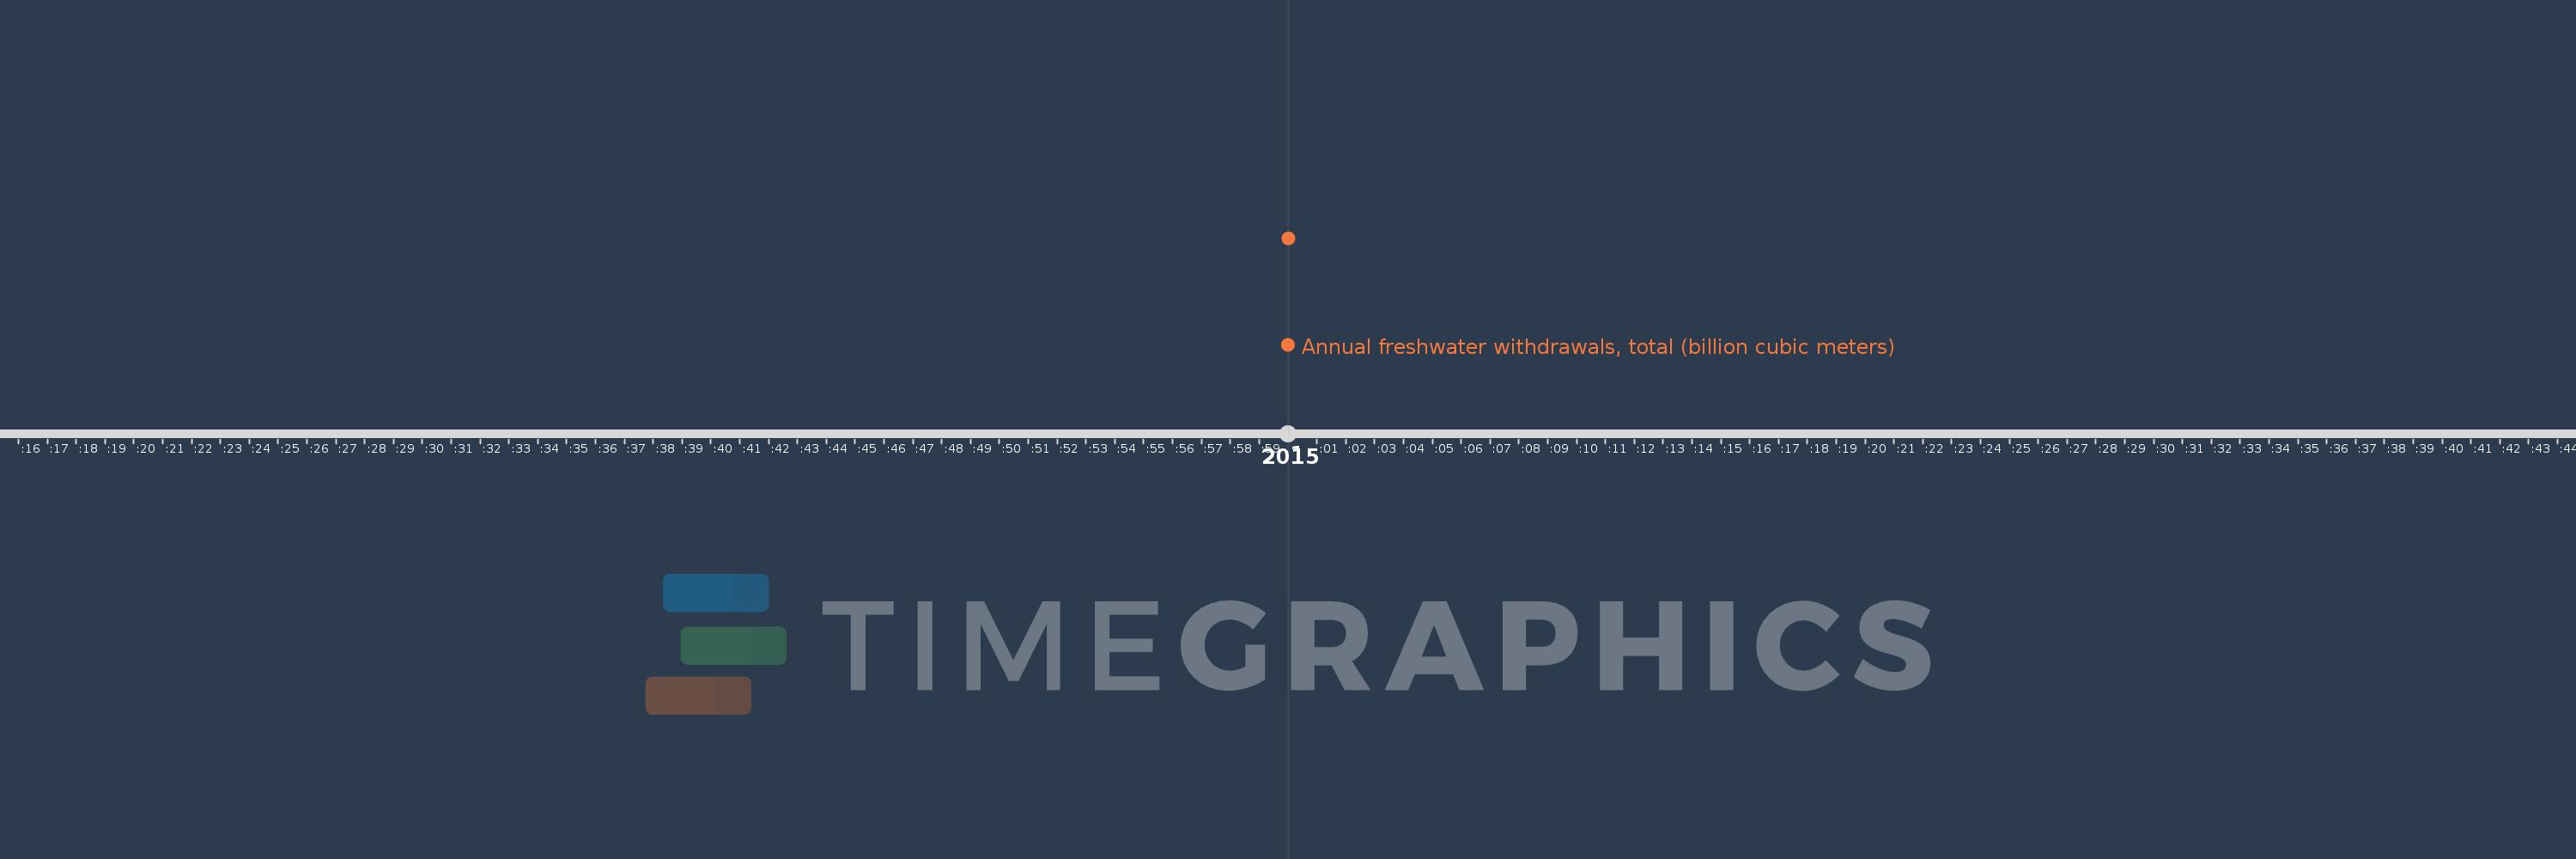
This timeline shows a graph from 2015 to 2015 of Sub-Saharan Africa (excluding high income). No data until 2014. Number of actual observations by date: 1.
Source name:
World Development Indicators
Source organization:
Food and Agriculture Organization, AQUASTAT data.
Categories, topics:
Climate Change, Infrastructure, Environment
Last updated:
apr 23, 2017
Indicators value changes by year
Meaning:
124.381
Minimum:
124.381
jan 1, 2015
Maximum:
124.381
jan 1, 2015
At the date of observation
Value
Absolute change
Change from the previous value
jan 1, 2015
124.381
+124.381
0.0%
Ranking of countries by current statistics by years