Download This statistics in other country:
AlbaniaAlgeriaAmerican SamoaAntigua and BarbudaArab WorldArgentinaArmeniaArubaAustraliaAustriaAzerbaijanBahamas, TheBahrainBangladeshBarbadosBelarusBelgiumBelizeBeninBermudaBhutanBoliviaBosnia and HerzegovinaBotswanaBrazilBritish Virgin IslandsBulgariaBurkina FasoBurundiCabo VerdeCambodiaCameroonCanadaCaribbean small statesCayman IslandsCentral Europe and the BalticsChileColombiaCosta RicaCroatiaCubaCyprusCzech RepublicDenmarkDominicaDominican RepublicEarly-demographic dividendEcuadorEgypt, Arab Rep.El SalvadorEstoniaEthiopiaEuro areaEurope & Central AsiaEurope & Central Asia (excluding high income)Europe & Central Asia (IDA & IBRD countries)European UnionFaroe IslandsFijiFinlandFranceFrench PolynesiaGabonGambia, TheGeorgiaGermanyGhanaGreeceGrenadaGuamGuatemalaGuineaGuyanaHaitiHigh incomeHondurasHong Kong SAR, ChinaHungaryIcelandIndiaIndonesiaIran, Islamic Rep.IrelandIsle of ManIsraelItalyJamaicaJapanJordanKazakhstanKiribatiKorea, Rep.KosovoKuwaitKyrgyz RepublicLao PDRLatin America & Caribbean Latin America & Caribbean (excluding high income)Latin America & the Caribbean (IDA & IBRD countries)LatviaLebanonLesothoLiberiaLibyaLithuaniaLower middle incomeLuxembourgMacao SAR, ChinaMacedonia, FYRMadagascarMalawiMalaysiaMaldivesMaliMaltaMarshall IslandsMauritiusMexicoMiddle East & North AfricaMiddle East & North Africa (excluding high income)Middle East & North Africa (IDA & IBRD countries)MoldovaMonacoMongoliaMontenegroMoroccoMozambiqueNamibiaNauruNepalNetherlandsNew ZealandNicaraguaNigerNigeriaNorth AmericaNorthern Mariana IslandsNorwayOECD membersPakistanPalauPanamaParaguayPeruPhilippinesPolandPortugalPost-demographic dividendPuerto RicoQatarRomaniaRussian FederationRwandaSamoaSan MarinoSao Tome and PrincipeSaudi ArabiaSenegalSerbiaSeychellesSierra LeoneSingaporeSlovak RepublicSloveniaSolomon IslandsSouth AfricaSouth AsiaSouth Asia (IDA & IBRD)South SudanSpainSri LankaSt. Kitts and NevisSt. LuciaSt. Vincent and the GrenadinesSudanSurinameSwazilandSwedenSwitzerlandSyrian Arab RepublicTajikistanTanzaniaThailandTimor-LesteTongaTrinidad and TobagoTunisiaTurkeyUgandaUkraineUnited Arab EmiratesUnited KingdomUnited StatesUruguayVanuatuVenezuela, RBVietnamWest Bank and GazaYemen, Rep.ZambiaZimbabwe Timeline:
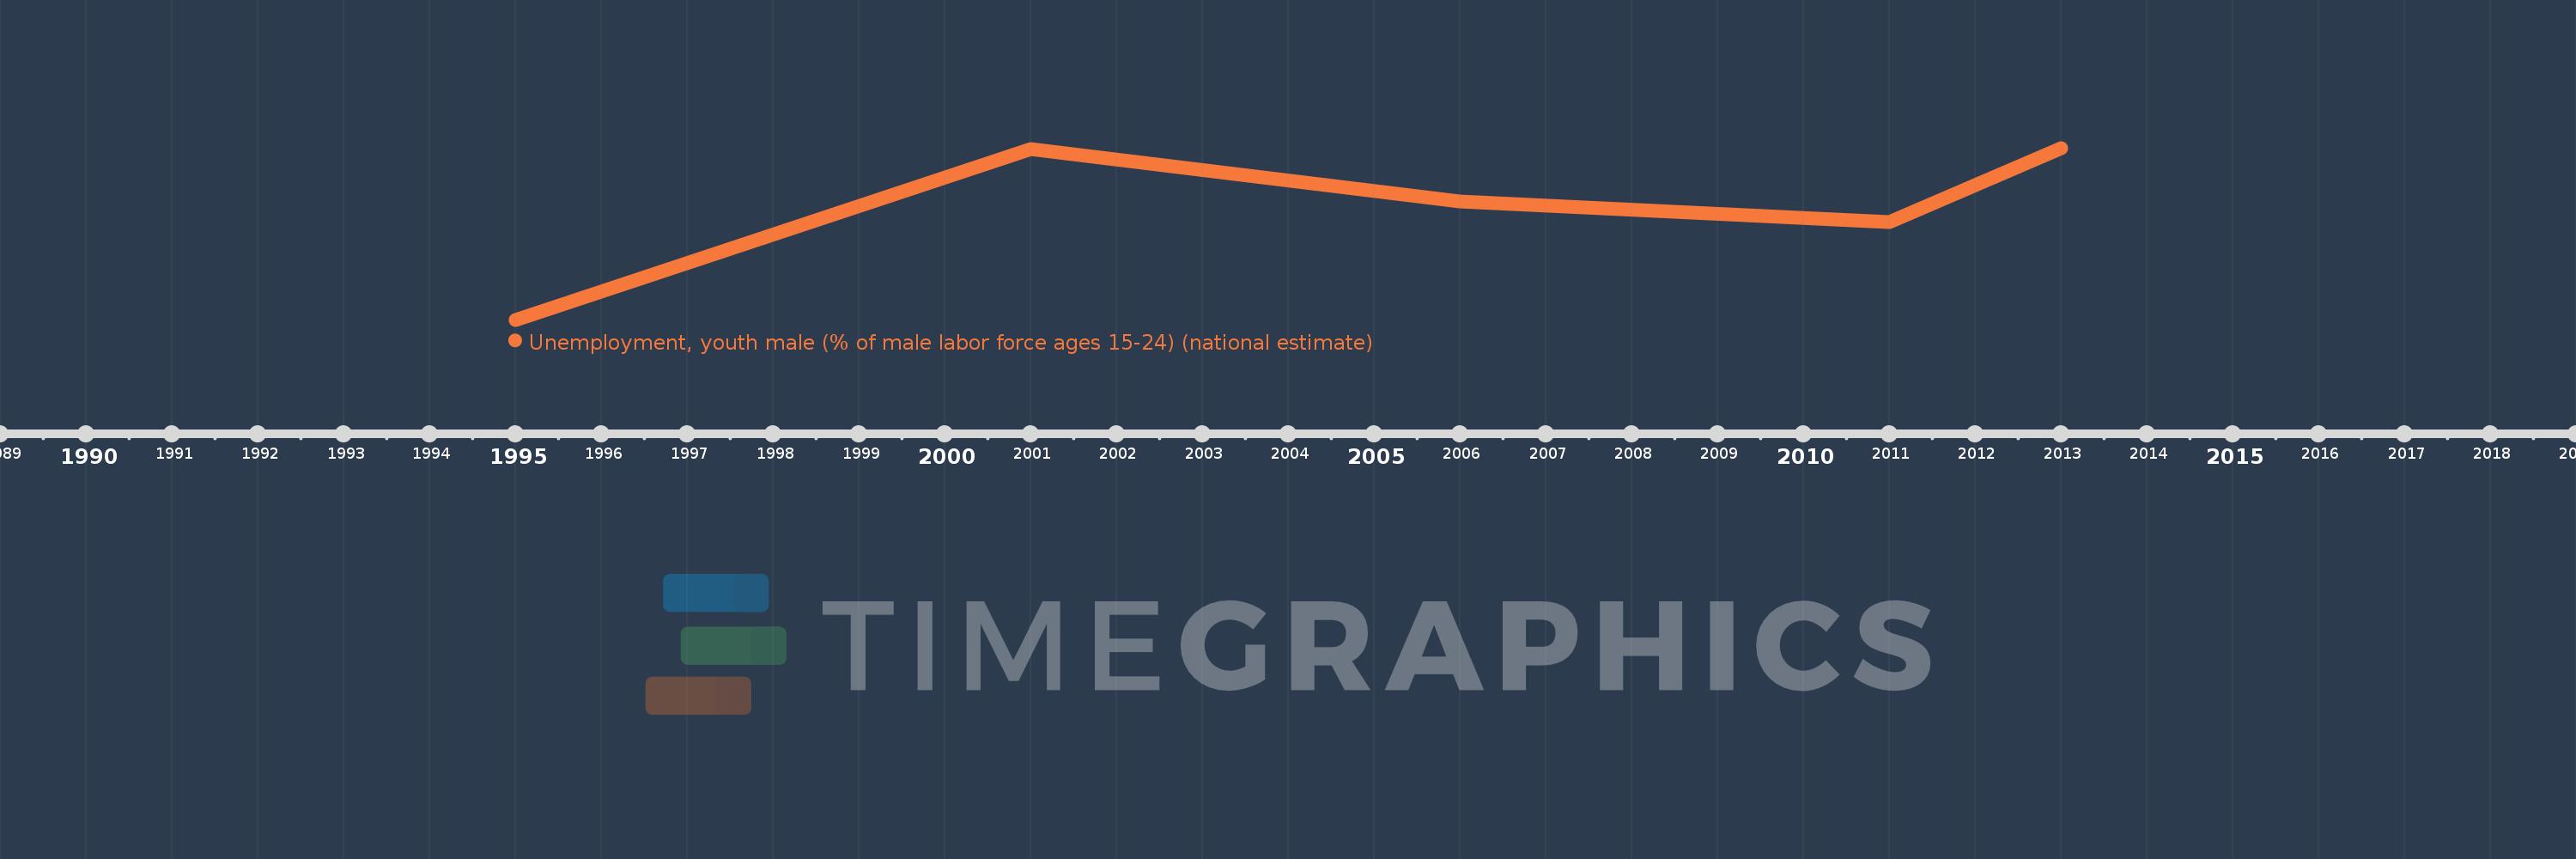
This timeline shows a graph from 1995 to 2013 of South Asia (IDA & IBRD). No data until 1994. Number of actual observations by date: 5.
Source name:
World Development Indicators
Source organization:
International Labour Organization, Key Indicators of the Labour Market database.
Categories, topics:
Social Protection & Labor
Last updated:
apr 23, 2017
Indicators value changes by year
Maximum:
10.442
jan 1, 2013
At the date of observation
Value
Absolute change
Change from the previous value
jan 1, 1995
8.147
+8.147
0.0%
jan 1, 2001
10.424
+2.276
27.94%
jan 1, 2006
9.73
-0.693
-6.65%
jan 1, 2011
9.456
-0.274
-2.82%
jan 1, 2013
10.442
+0.987
10.44%
Ranking of countries by current statistics by years