33
/
AIzaSyB4mHJ5NPEv-XzF7P6NDYXjlkCWaeKw5bc
November 30, 2025
56038
Small states
SST
false
2
1
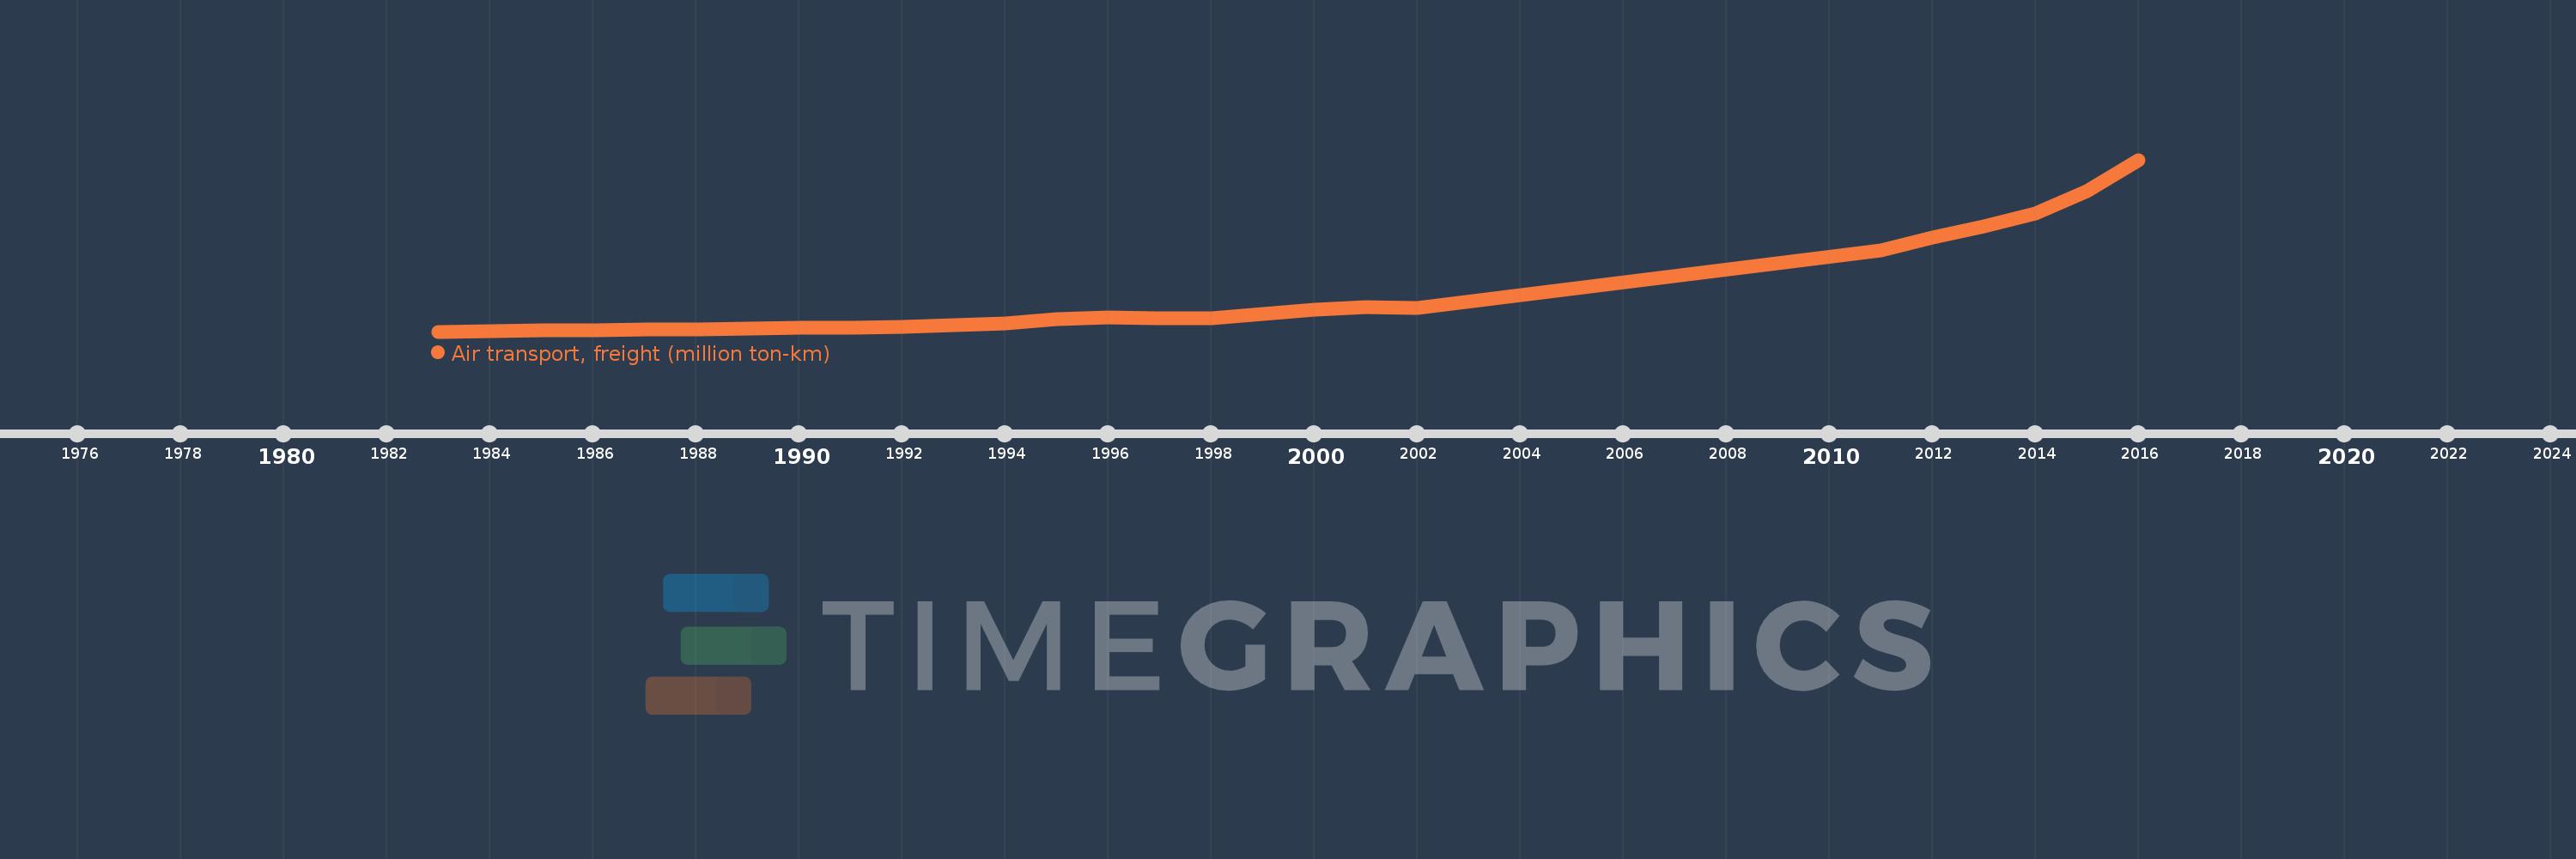
Air transport, freight (million ton-km)
2016,2015,2014,2013,2012,2011,2002,2001,2000,1998,1997,1996,1995,1994,1993,1992,1991,1990,1989,1988,1987,1986,1985,1984,1983