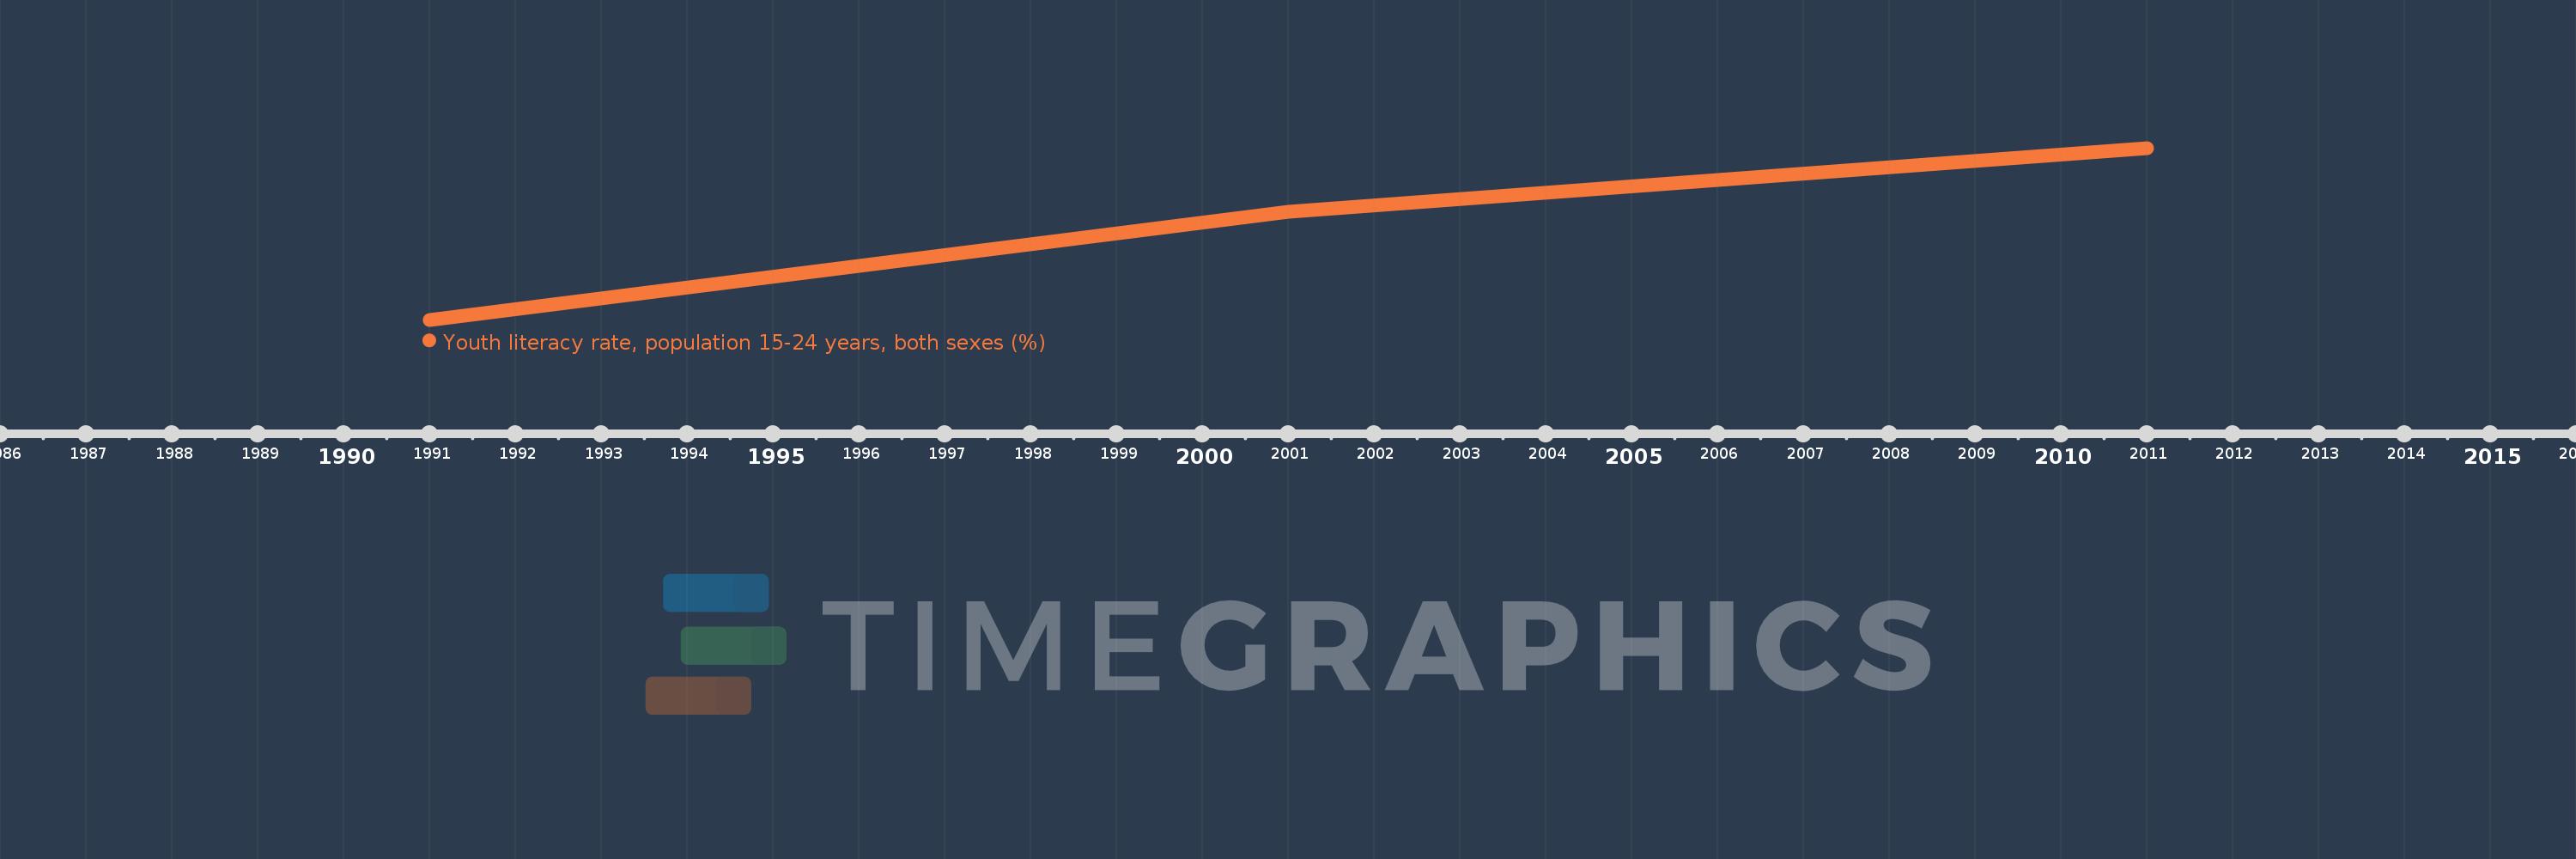
This timeline shows a graph from 1991 to 2011 of Middle East & North Africa (IDA & IBRD countries). No data until 1990. Number of actual observations by date: 3.
Source name:
World Development Indicators
Source organization:
UNESCO Institute for Statistics
Categories, topics:
Education
Last updated:
apr 23, 2017
Indicators value changes by year
Meaning:
84.578
Minimum:
76.054
jan 1, 1991
Maximum:
91.749
jan 1, 2011
At the date of observation
Value
Absolute change
Change from the previous value
jan 1, 1991
76.054
+76.054
0.0%
jan 1, 2001
85.931
+9.877
12.99%
jan 1, 2011
91.749
+5.819
6.77%
Ranking of countries by current statistics by years