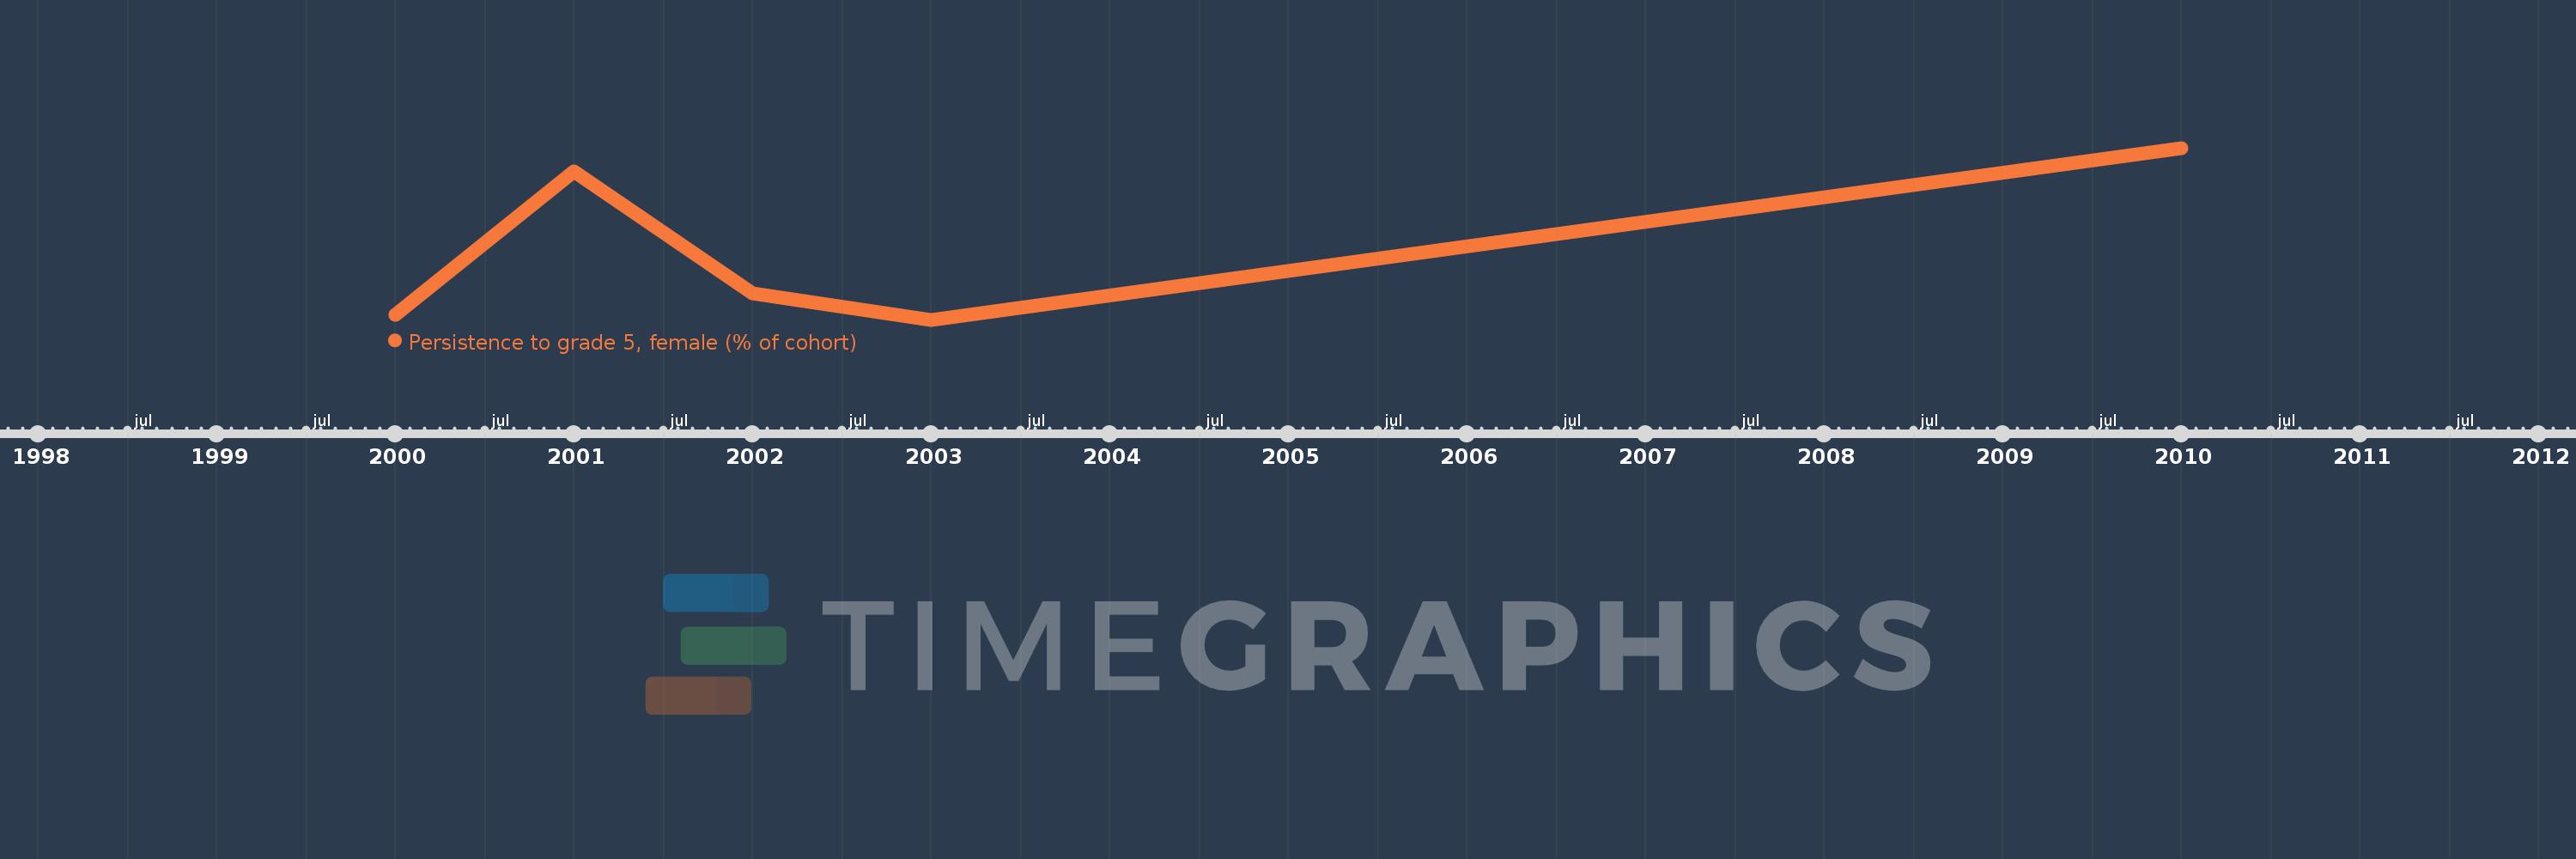
This timeline shows a graph from 2000 to 2010 of Middle East & North Africa (IDA & IBRD countries). No data until 1999. Number of actual observations by date: 5.
Source name:
World Development Indicators
Source organization:
United Nations Educational, Scientific, and Cultural Organization (UNESCO) Institute for Statistics.
Categories, topics:
Education, Gender
Last updated:
apr 23, 2017
Indicators value changes by year
Meaning:
92.235
Minimum:
89.666
jan 1, 2003
Maximum:
95.937
jan 1, 2010
At the date of observation
Value
Absolute change
Change from the previous value
jan 1, 2000
89.844
+89.844
0.0%
jan 1, 2001
95.094
+5.25
5.84%
jan 1, 2002
90.635
-4.46
-4.69%
jan 1, 2003
89.666
-0.968
-1.07%
jan 1, 2010
95.937
+6.27
6.99%
Ranking of countries by current statistics by years