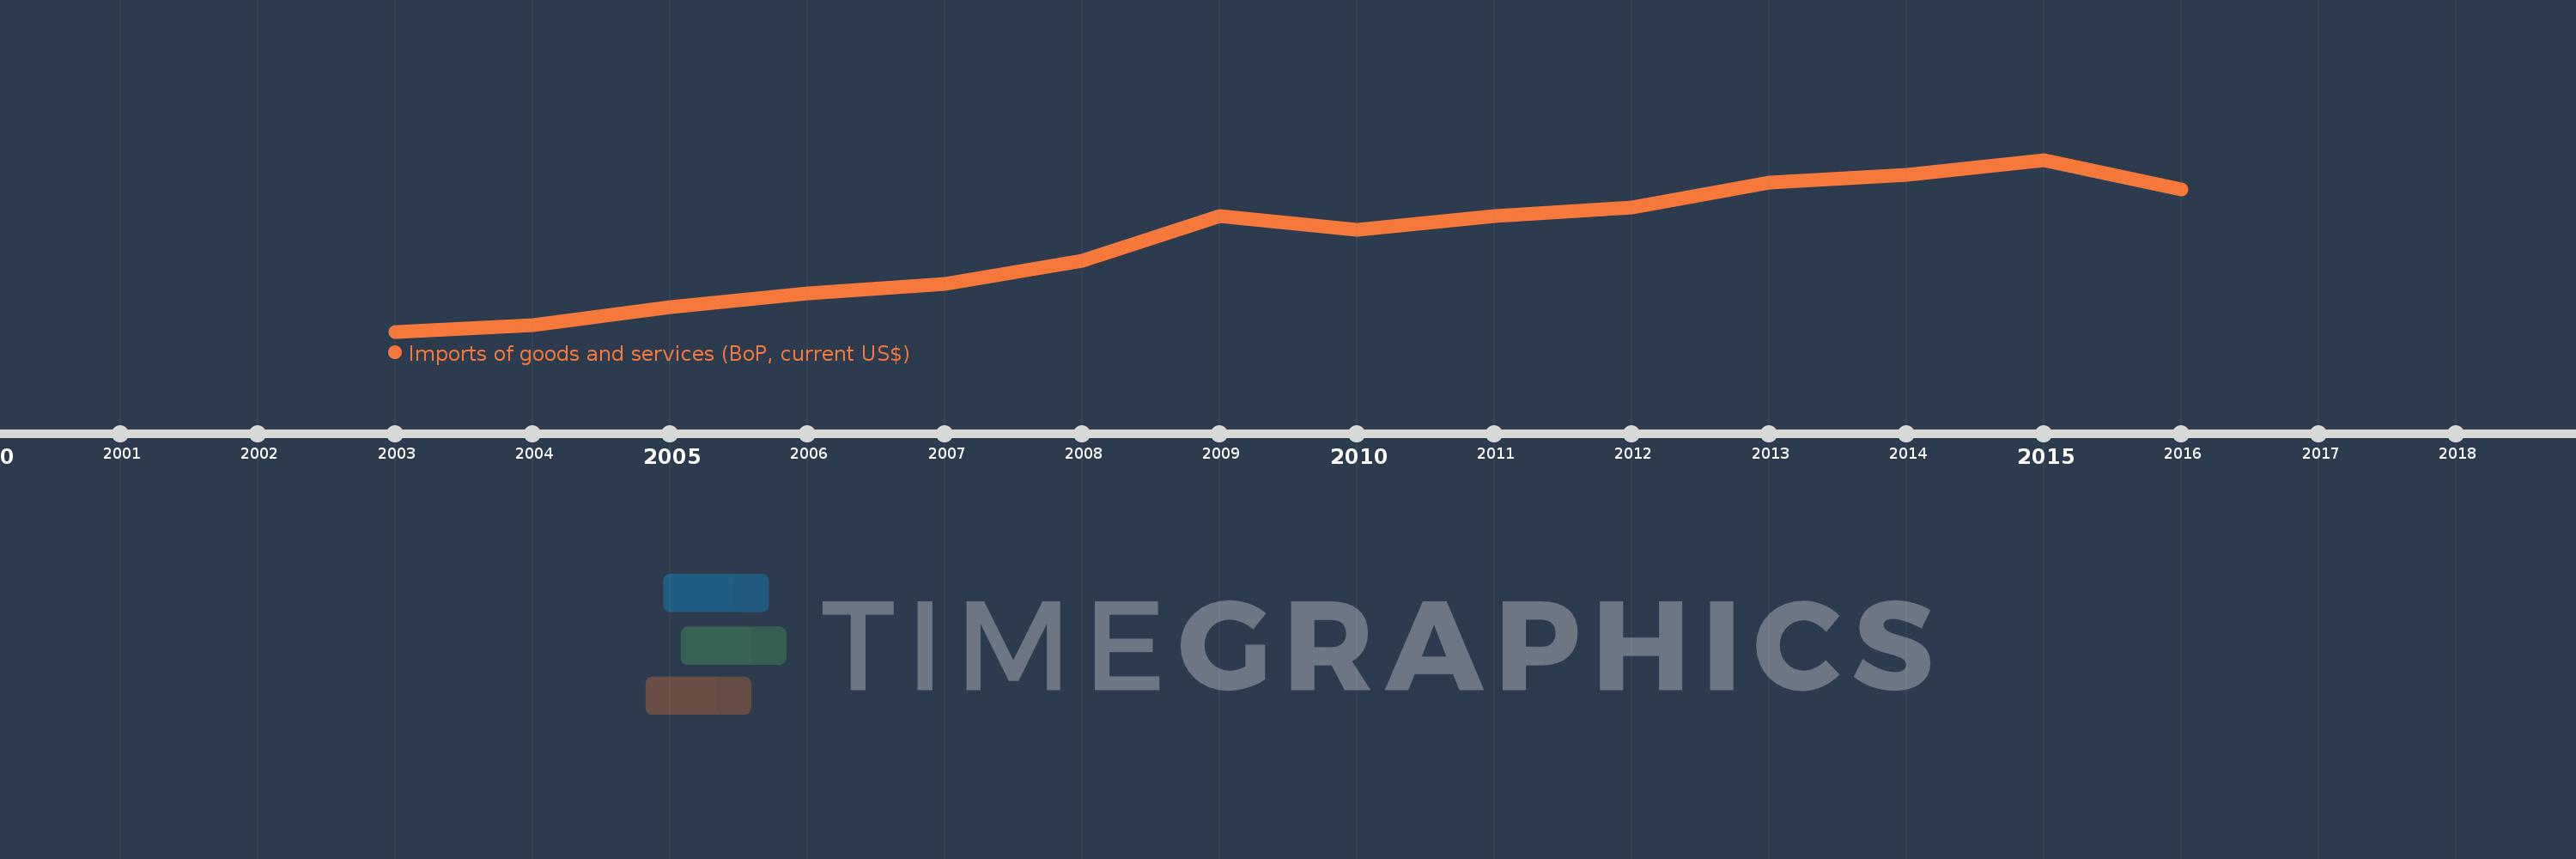
This timeline shows a graph from 2003 to 2016 of Middle East & North Africa (IDA & IBRD countries). No data until 2002. Number of actual observations by date: 14.
Source name:
World Development Indicators
Source organization:
International Monetary Fund, Balance of Payments Statistics Yearbook and data files.
Categories, topics:
Economy & Growth, Trade
Last updated:
apr 23, 2017
Indicators value changes by year
Meaning:
347.03 bln
Minimum:
131.89 bln
jan 1, 2003
Maximum:
540.974 bln
jan 1, 2015
At the date of observation
Value
Absolute change
Change from the previous value
jan 1, 2003
131.89 bln
+131.89 bln
0.0%
jan 1, 2004
146.702 bln
+14.812 bln
11.23%
jan 1, 2005
190.953 bln
+44.251 bln
30.16%
jan 1, 2006
222.943 bln
+31.989 bln
16.75%
jan 1, 2007
244.532 bln
+21.589 bln
9.68%
jan 1, 2008
301.285 bln
+56.754 bln
23.21%
jan 1, 2009
407.942 bln
+106.656 bln
35.4%
jan 1, 2010
375.155 bln
-32.787 bln
-8.04%
jan 1, 2011
407.104 bln
+31.949 bln
8.52%
jan 1, 2012
427.608 bln
+20.504 bln
5.04%
jan 1, 2013
486.113 bln
+58.505 bln
13.68%
jan 1, 2014
505.354 bln
+19.241 bln
3.96%
jan 1, 2015
540.974 bln
+35.62 bln
7.05%
jan 1, 2016
469.87 bln
-71.103 bln
-13.14%
Ranking of countries by current statistics by years