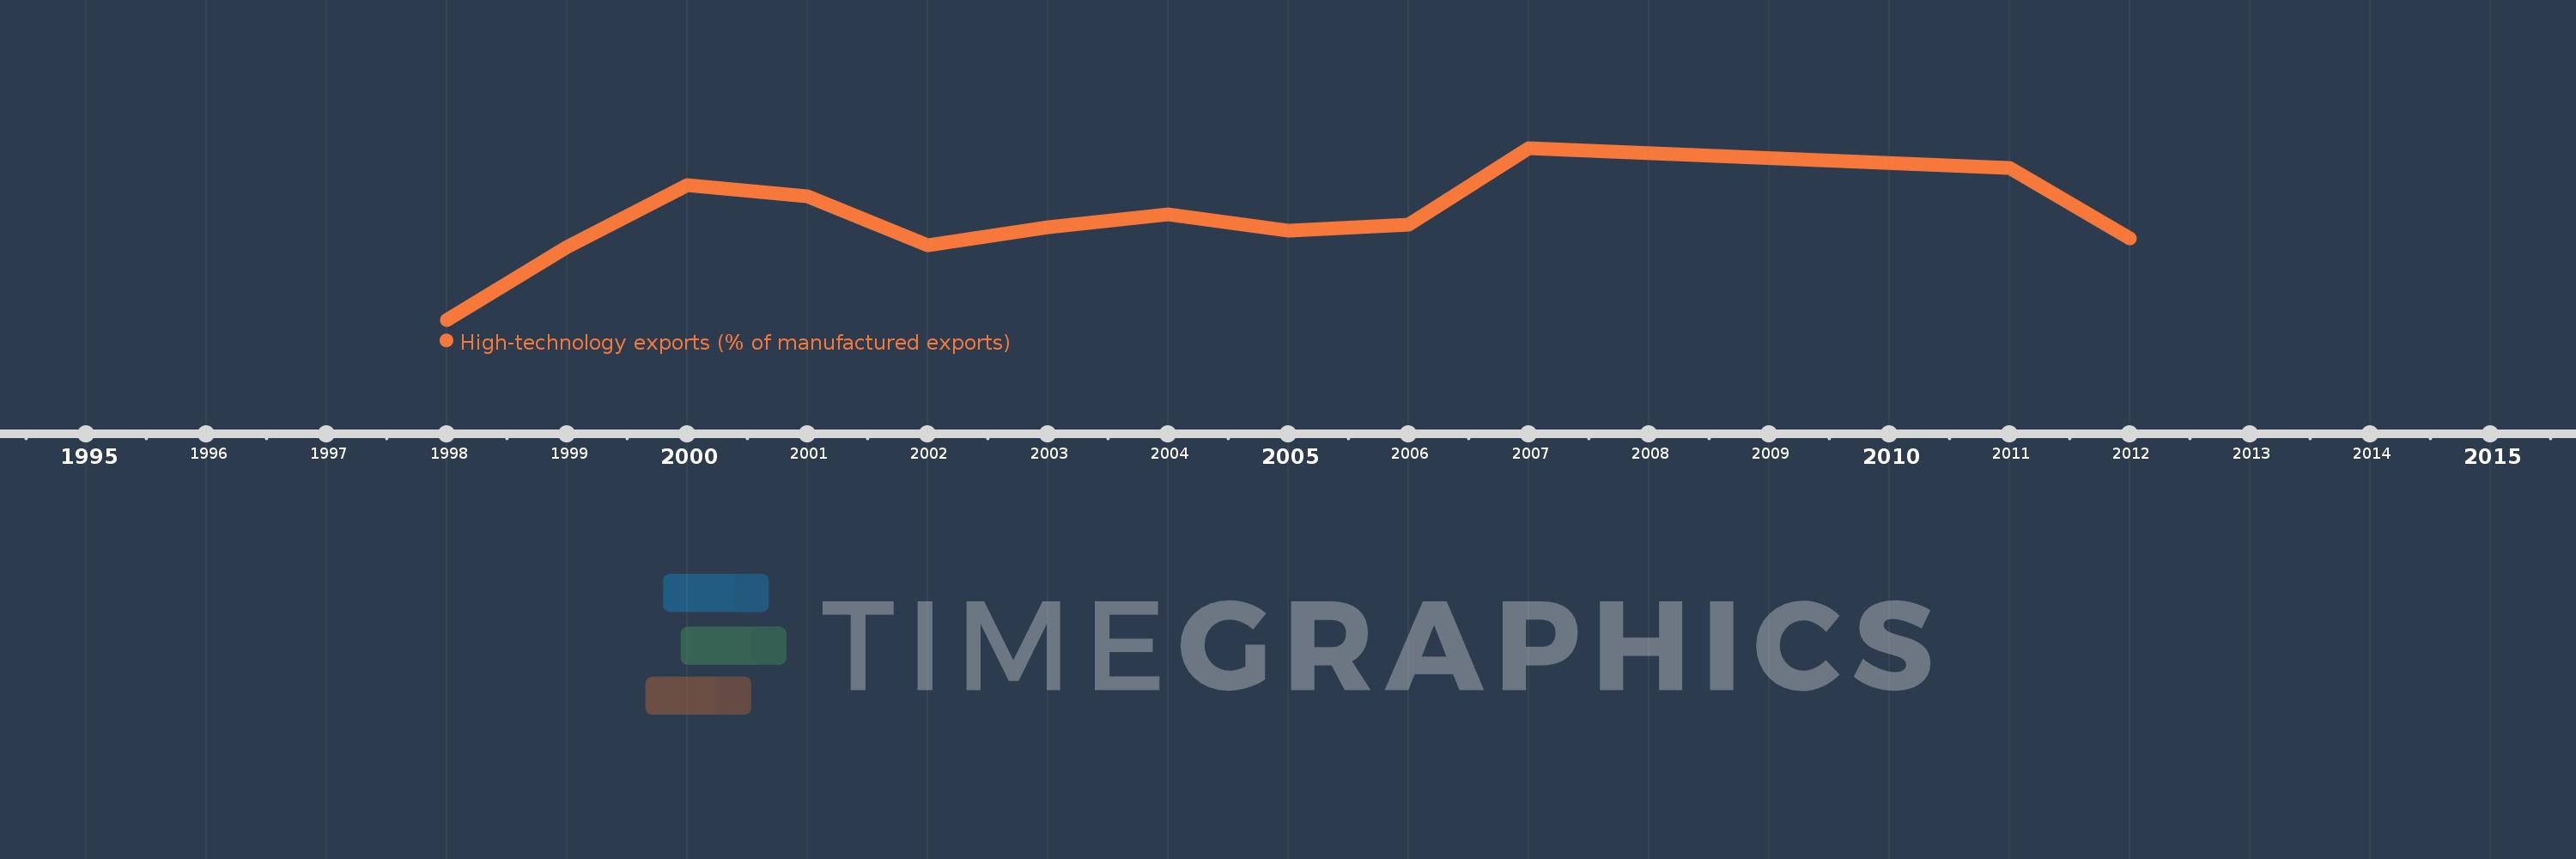
This timeline shows a graph from 1998 to 2012 of Middle East & North Africa (IDA & IBRD countries). No data until 1997. Number of actual observations by date: 12.
Source name:
World Development Indicators
Source organization:
United Nations, Comtrade database.
Categories, topics:
Private Sector, Science & Technology, Trade
Last updated:
apr 23, 2017
Indicators value changes by year
Meaning:
2.734
Minimum:
0.957
jan 1, 1998
Maximum:
4.029
jan 1, 2007
At the date of observation
Value
Absolute change
Change from the previous value
jan 1, 1998
0.957
+0.957
0.0%
jan 1, 1999
2.251
+1.294
135.33%
jan 1, 2000
3.365
+1.114
49.49%
jan 1, 2001
3.168
-0.197
-5.86%
jan 1, 2002
2.292
-0.876
-27.64%
jan 1, 2003
2.604
+0.312
13.62%
jan 1, 2004
2.836
+0.232
8.9%
jan 1, 2005
2.553
-0.283
-9.99%
jan 1, 2006
2.662
+0.109
4.28%
jan 1, 2007
4.029
+1.367
51.35%
jan 1, 2011
3.669
-0.36
-8.93%
jan 1, 2012
2.416
-1.254
-34.16%
Ranking of countries by current statistics by years