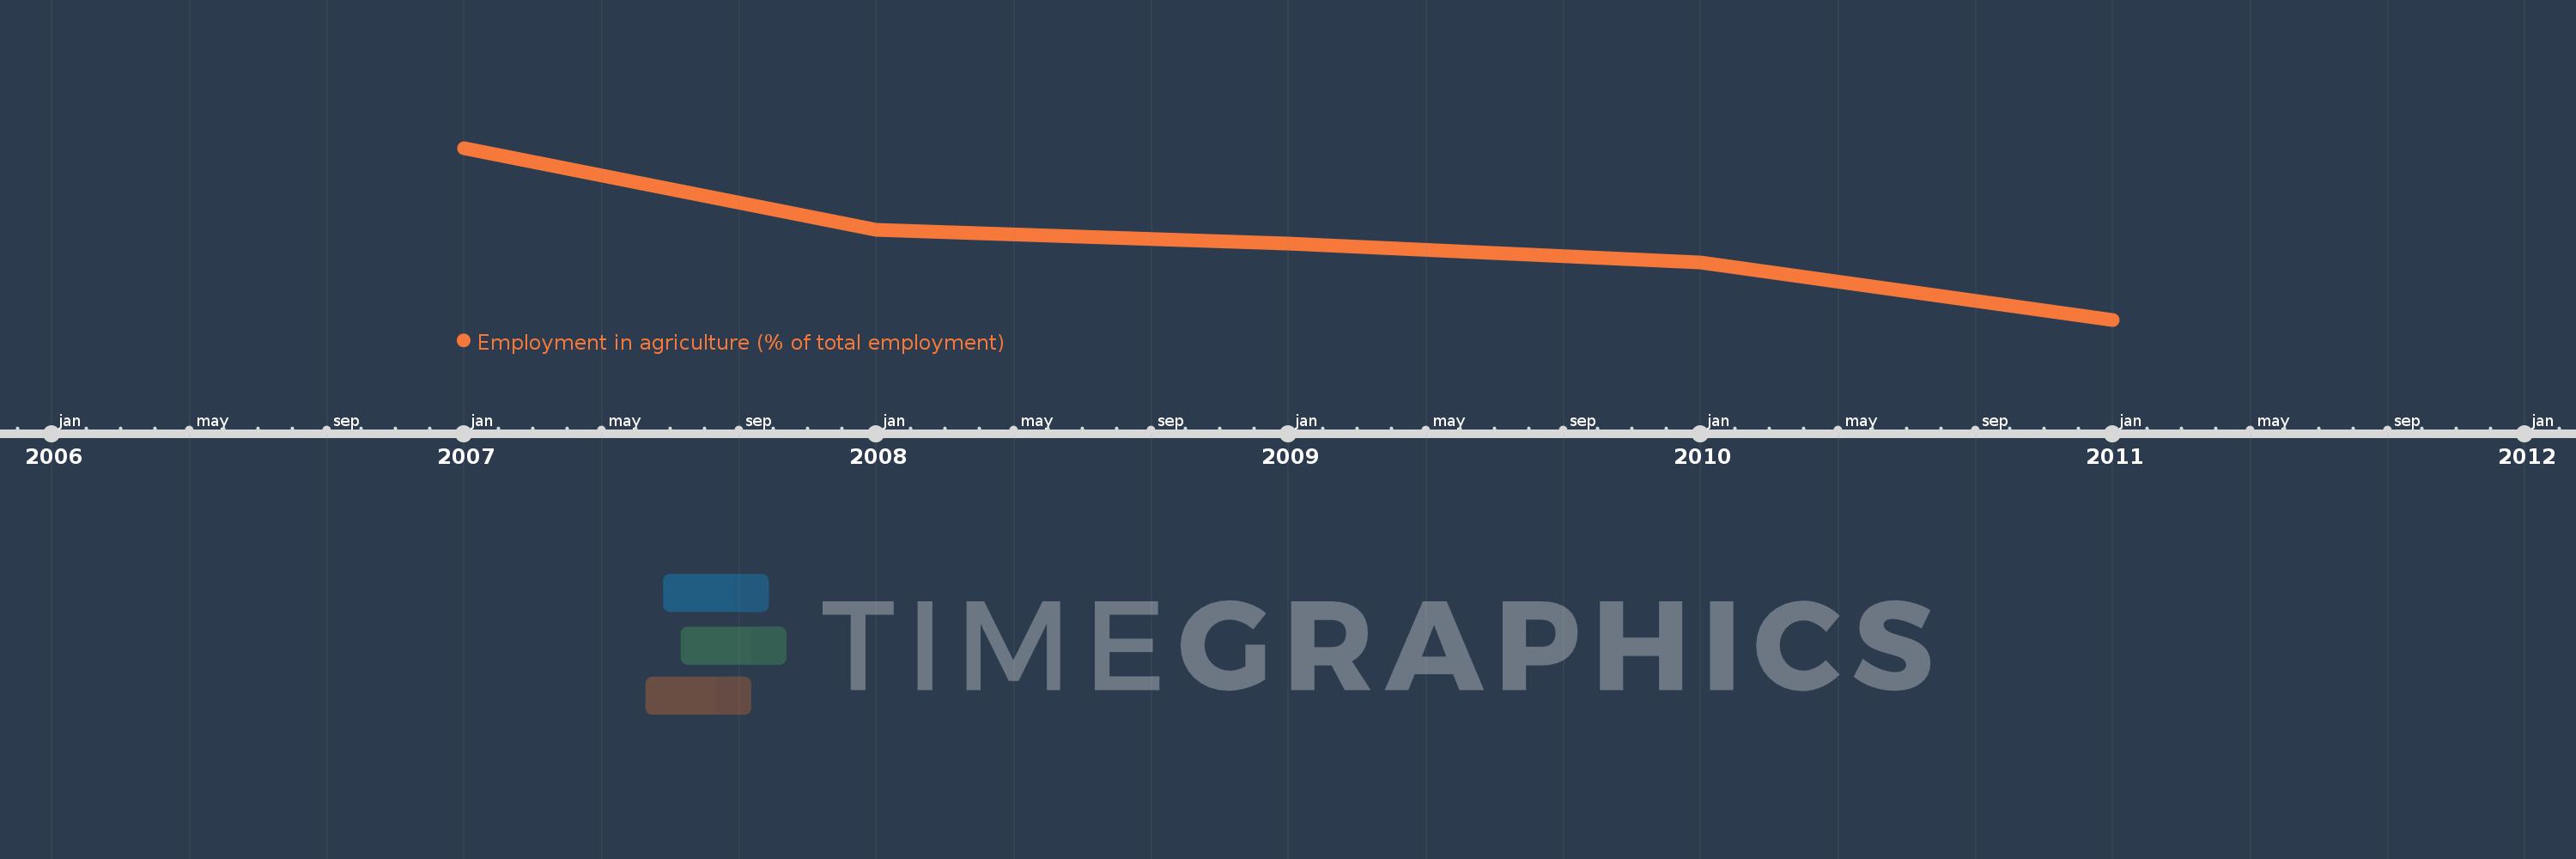
This timeline shows a graph from 2007 to 2011 of Middle East & North Africa (IDA & IBRD countries). No data until 2006. Number of actual observations by date: 5.
Source name:
World Development Indicators
Source organization:
International Labour Organization, Key Indicators of the Labour Market database.
Categories, topics:
Agriculture & Rural Development, Social Protection & Labor
Last updated:
apr 23, 2017
Indicators value changes by year
Meaning:
26.769
Minimum:
24.991
jan 1, 2011
Maximum:
28.859
jan 1, 2007
At the date of observation
Value
Absolute change
Change from the previous value
jan 1, 2007
28.859
+28.859
0.0%
jan 1, 2008
27.015
-1.844
-6.39%
jan 1, 2009
26.699
-0.316
-1.17%
jan 1, 2010
26.279
-0.421
-1.58%
jan 1, 2011
24.991
-1.287
-4.9%
Ranking of countries by current statistics by years