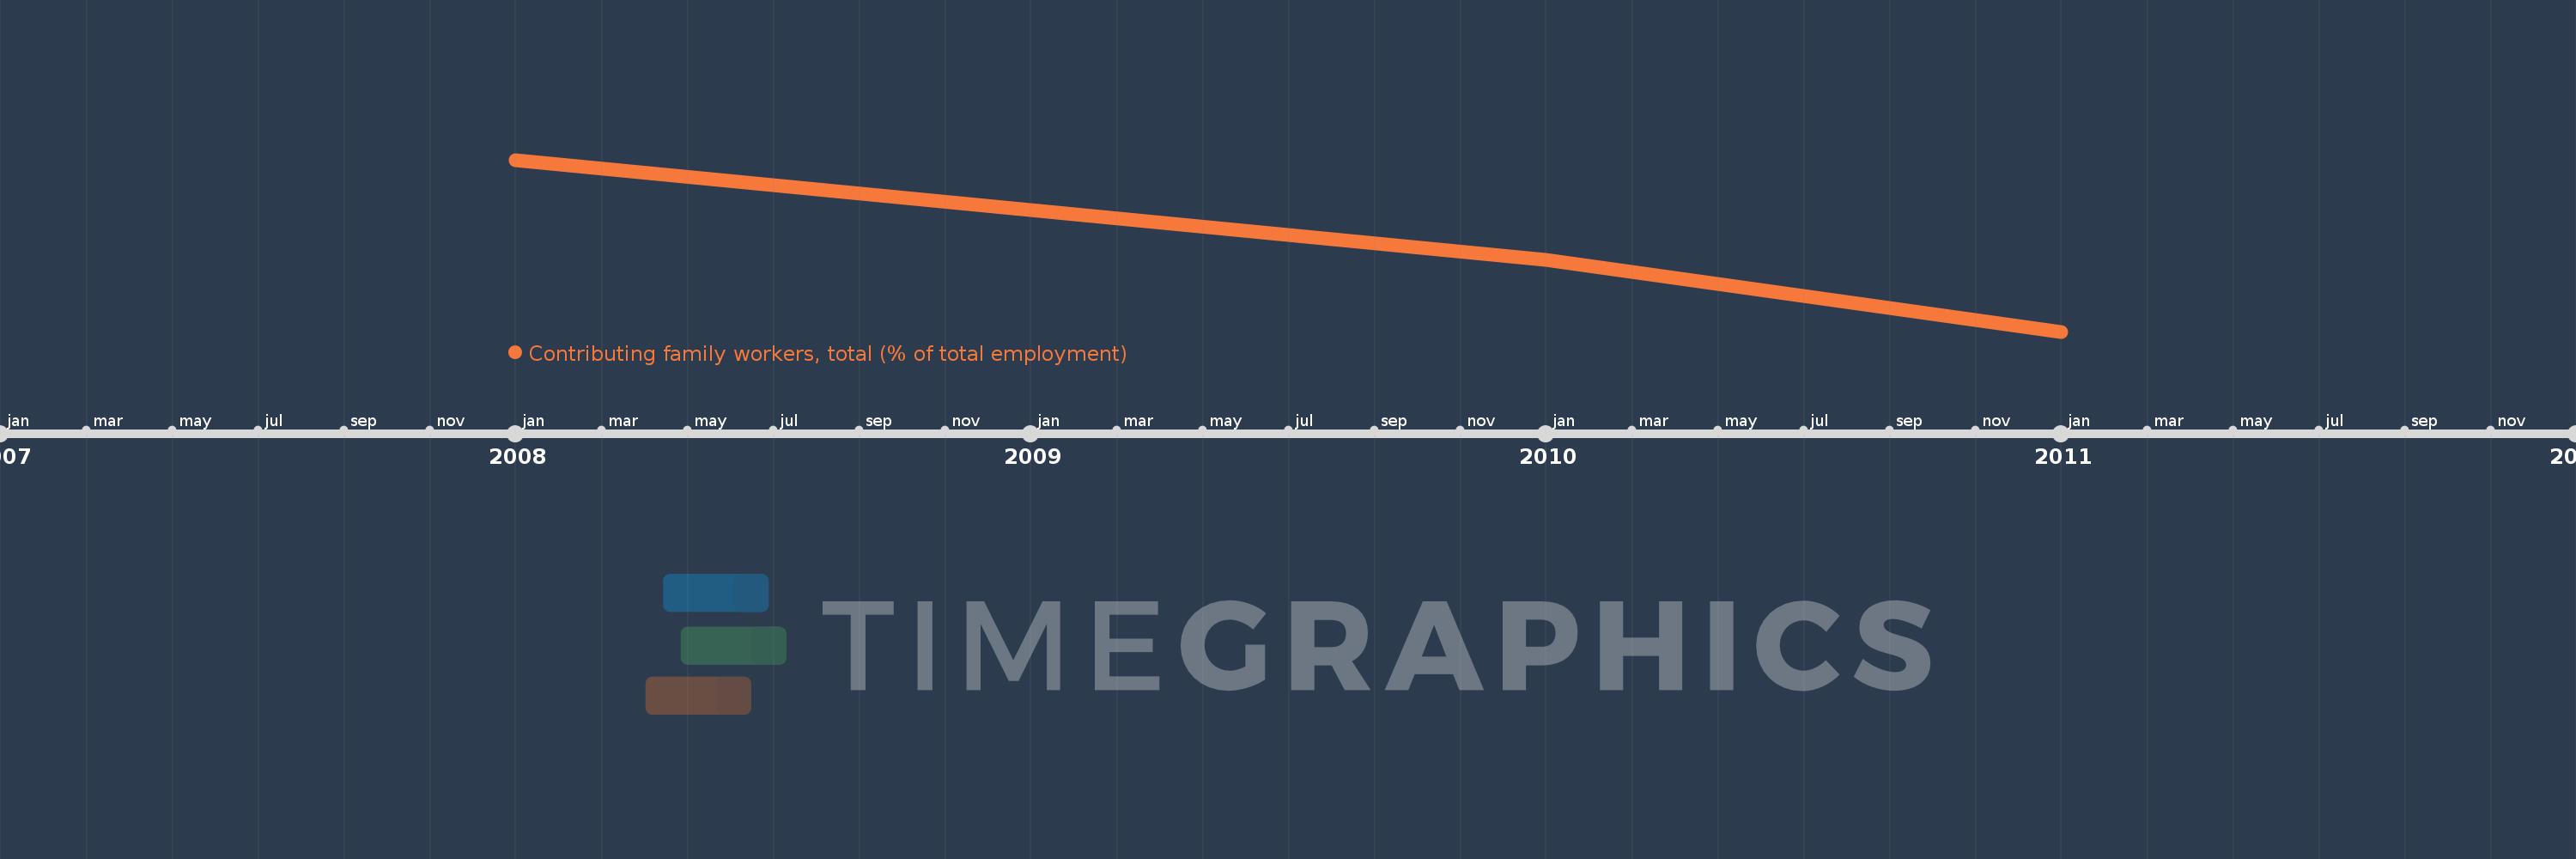
This timeline shows a graph from 2008 to 2011 of Middle East & North Africa (IDA & IBRD countries). No data until 2007. Number of actual observations by date: 3.
Source name:
World Development Indicators
Source organization:
International Labour Organization, Key Indicators of the Labour Market database.
Categories, topics:
Social Protection & Labor
Last updated:
apr 23, 2017
Indicators value changes by year
Meaning:
11.544
Minimum:
9.837
jan 1, 2011
Maximum:
13.443
jan 1, 2008
At the date of observation
Value
Absolute change
Change from the previous value
jan 1, 2008
13.443
+13.443
0.0%
jan 1, 2010
11.351
-2.092
-15.56%
jan 1, 2011
9.837
-1.514
-13.34%
Ranking of countries by current statistics by years