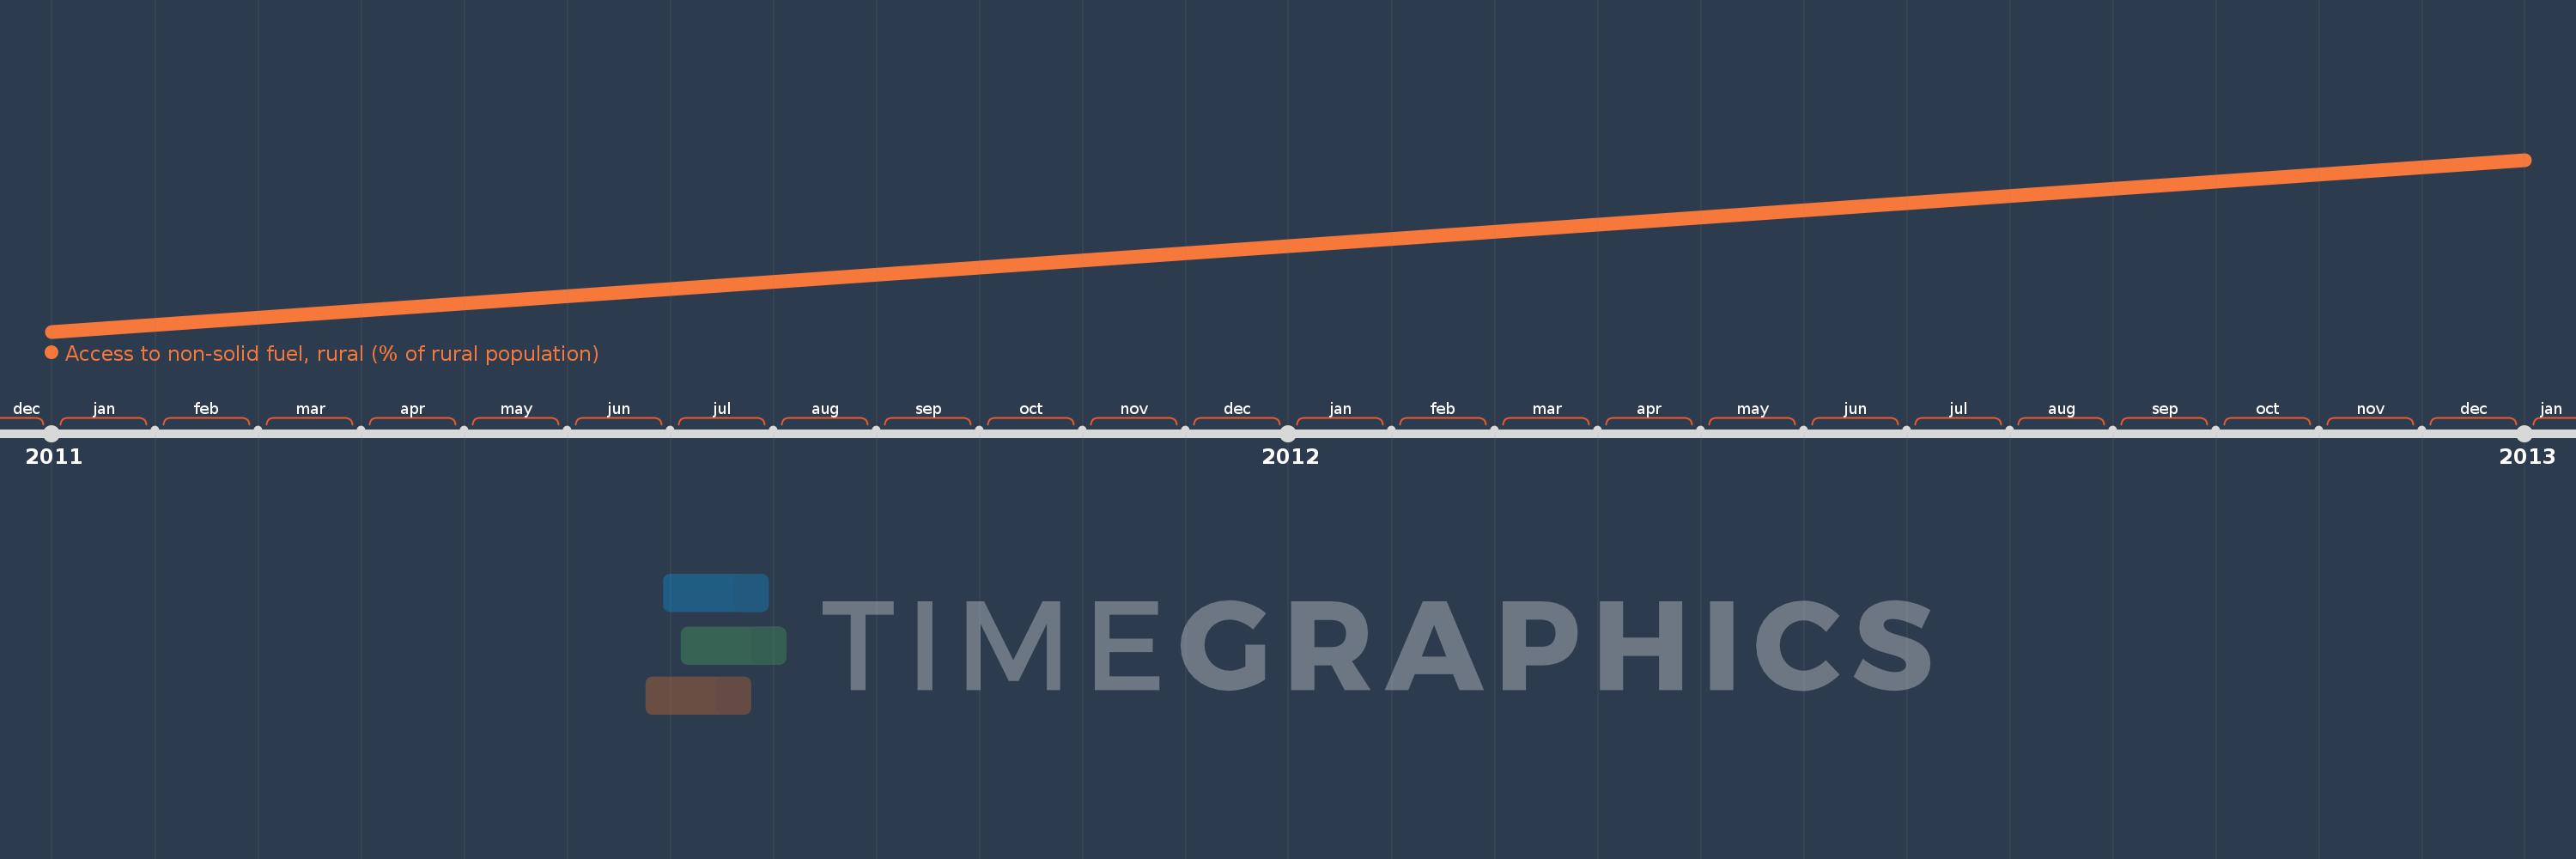
This timeline shows a graph from 2011 to 2013 of Middle East & North Africa (IDA & IBRD countries). No data until 2010. Number of actual observations by date: 2.
Source name:
World Development Indicators
Source organization:
World Bank, Sustainable Energy for all (SE4ALL) database from WHO Global Household Energy database.
Categories, topics:
Agriculture & Rural Development, Energy & Mining
Last updated:
apr 23, 2017
Indicators value changes by year
Meaning:
92.094
Minimum:
91.96
jan 1, 2011
Maximum:
92.227
jan 1, 2013
At the date of observation
Value
Absolute change
Change from the previous value
jan 1, 2011
91.96
+91.96
0.0%
jan 1, 2013
92.227
+0.268
0.29%
Ranking of countries by current statistics by years