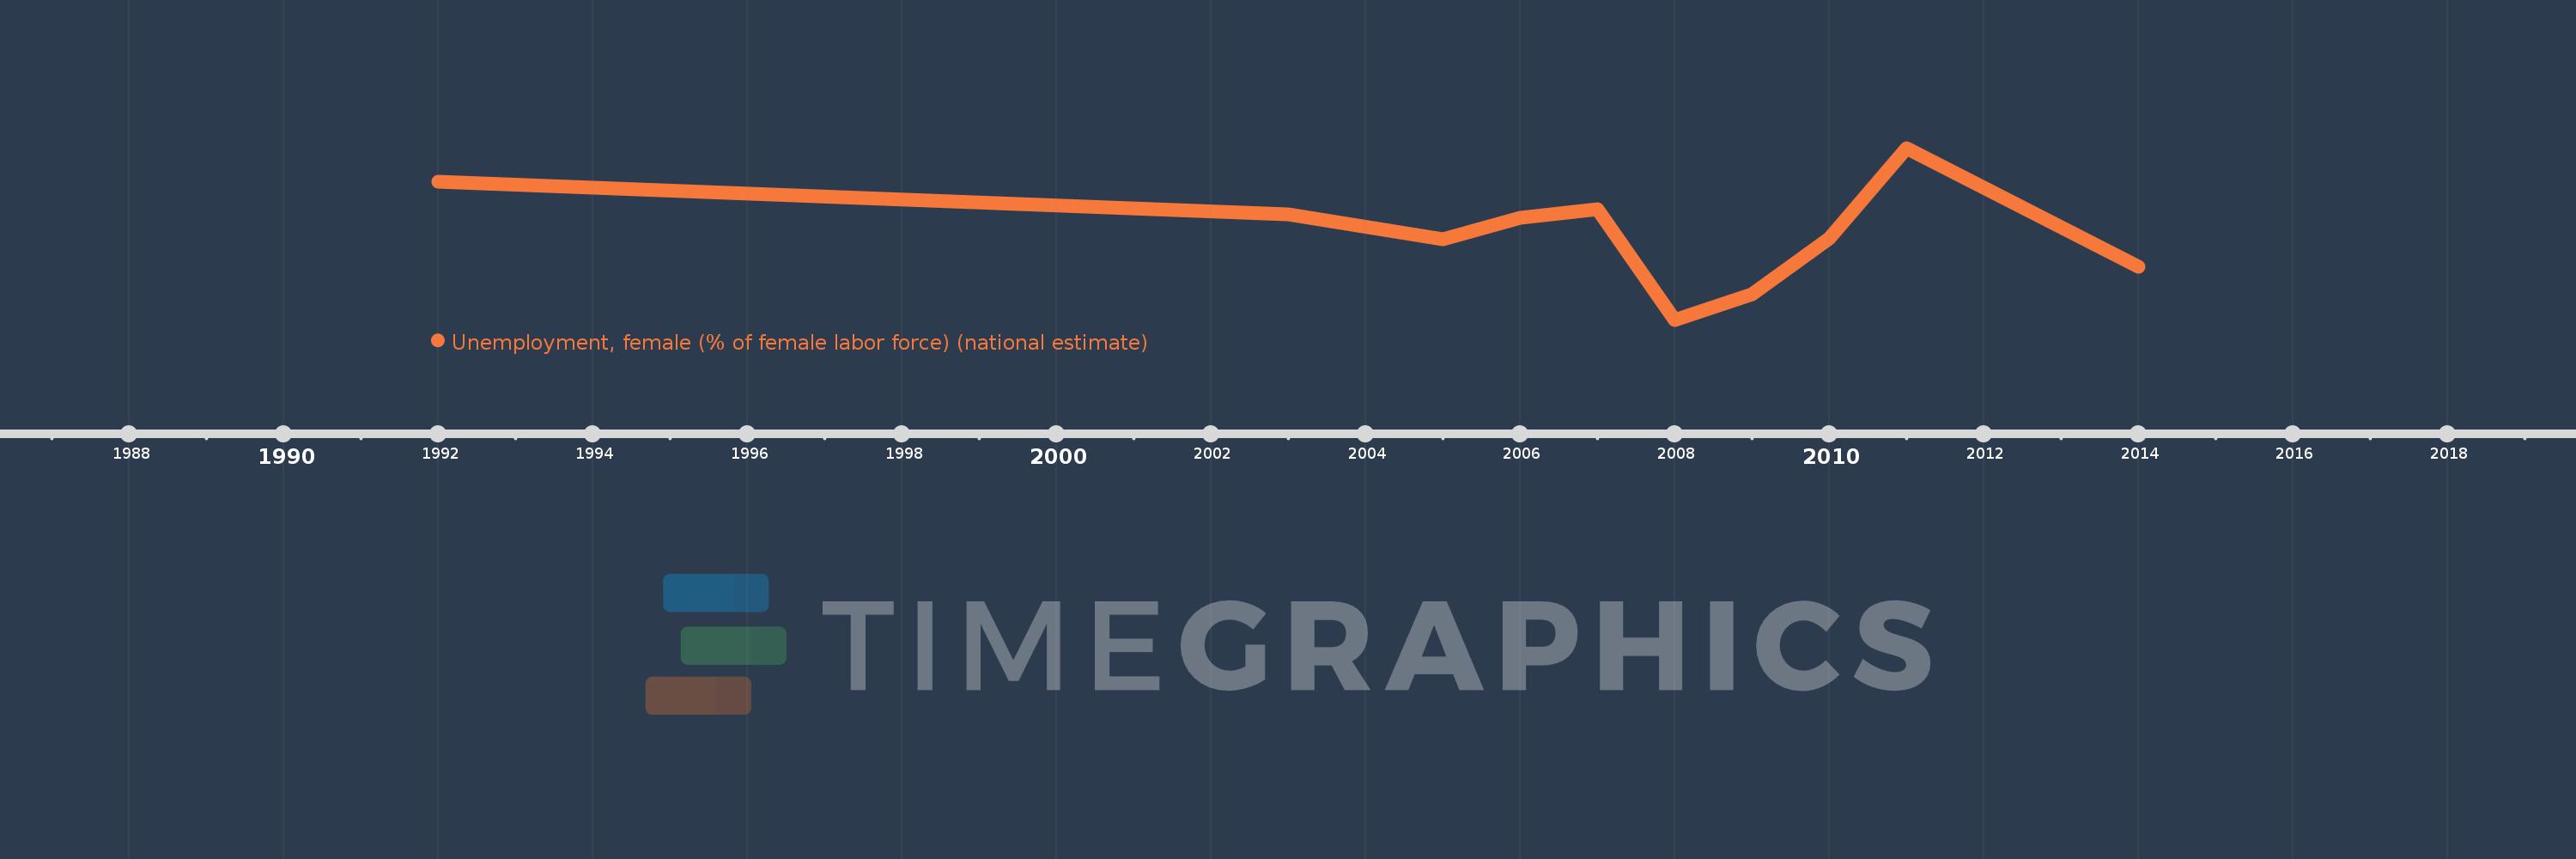
This timeline shows a graph from 1992 to 2014 of Middle East & North Africa (excluding high income). No data until 1991. Number of actual observations by date: 10.
Source name:
World Development Indicators
Source organization:
International Labour Organization, Key Indicators of the Labour Market database.
Categories, topics:
Social Protection & Labor
Last updated:
apr 23, 2017
Indicators value changes by year
Meaning:
20.379
Minimum:
18.405
jan 1, 2008
Maximum:
22.309
jan 1, 2011
At the date of observation
Value
Absolute change
Change from the previous value
jan 1, 1992
21.539
+21.539
0.0%
jan 1, 2003
20.803
-0.736
-3.42%
jan 1, 2005
20.237
-0.566
-2.72%
jan 1, 2006
20.729
+0.492
2.43%
jan 1, 2007
20.909
+0.181
0.87%
jan 1, 2008
18.405
-2.505
-11.98%
jan 1, 2009
18.983
+0.578
3.14%
jan 1, 2010
20.257
+1.274
6.71%
jan 1, 2011
22.309
+2.052
10.13%
jan 1, 2014
19.615
-2.693
-12.07%
Ranking of countries by current statistics by years