33
/
AIzaSyB4mHJ5NPEv-XzF7P6NDYXjlkCWaeKw5bc
November 30, 2025
49643
Middle East & North Africa (excluding high income)
MNA
false
2
1
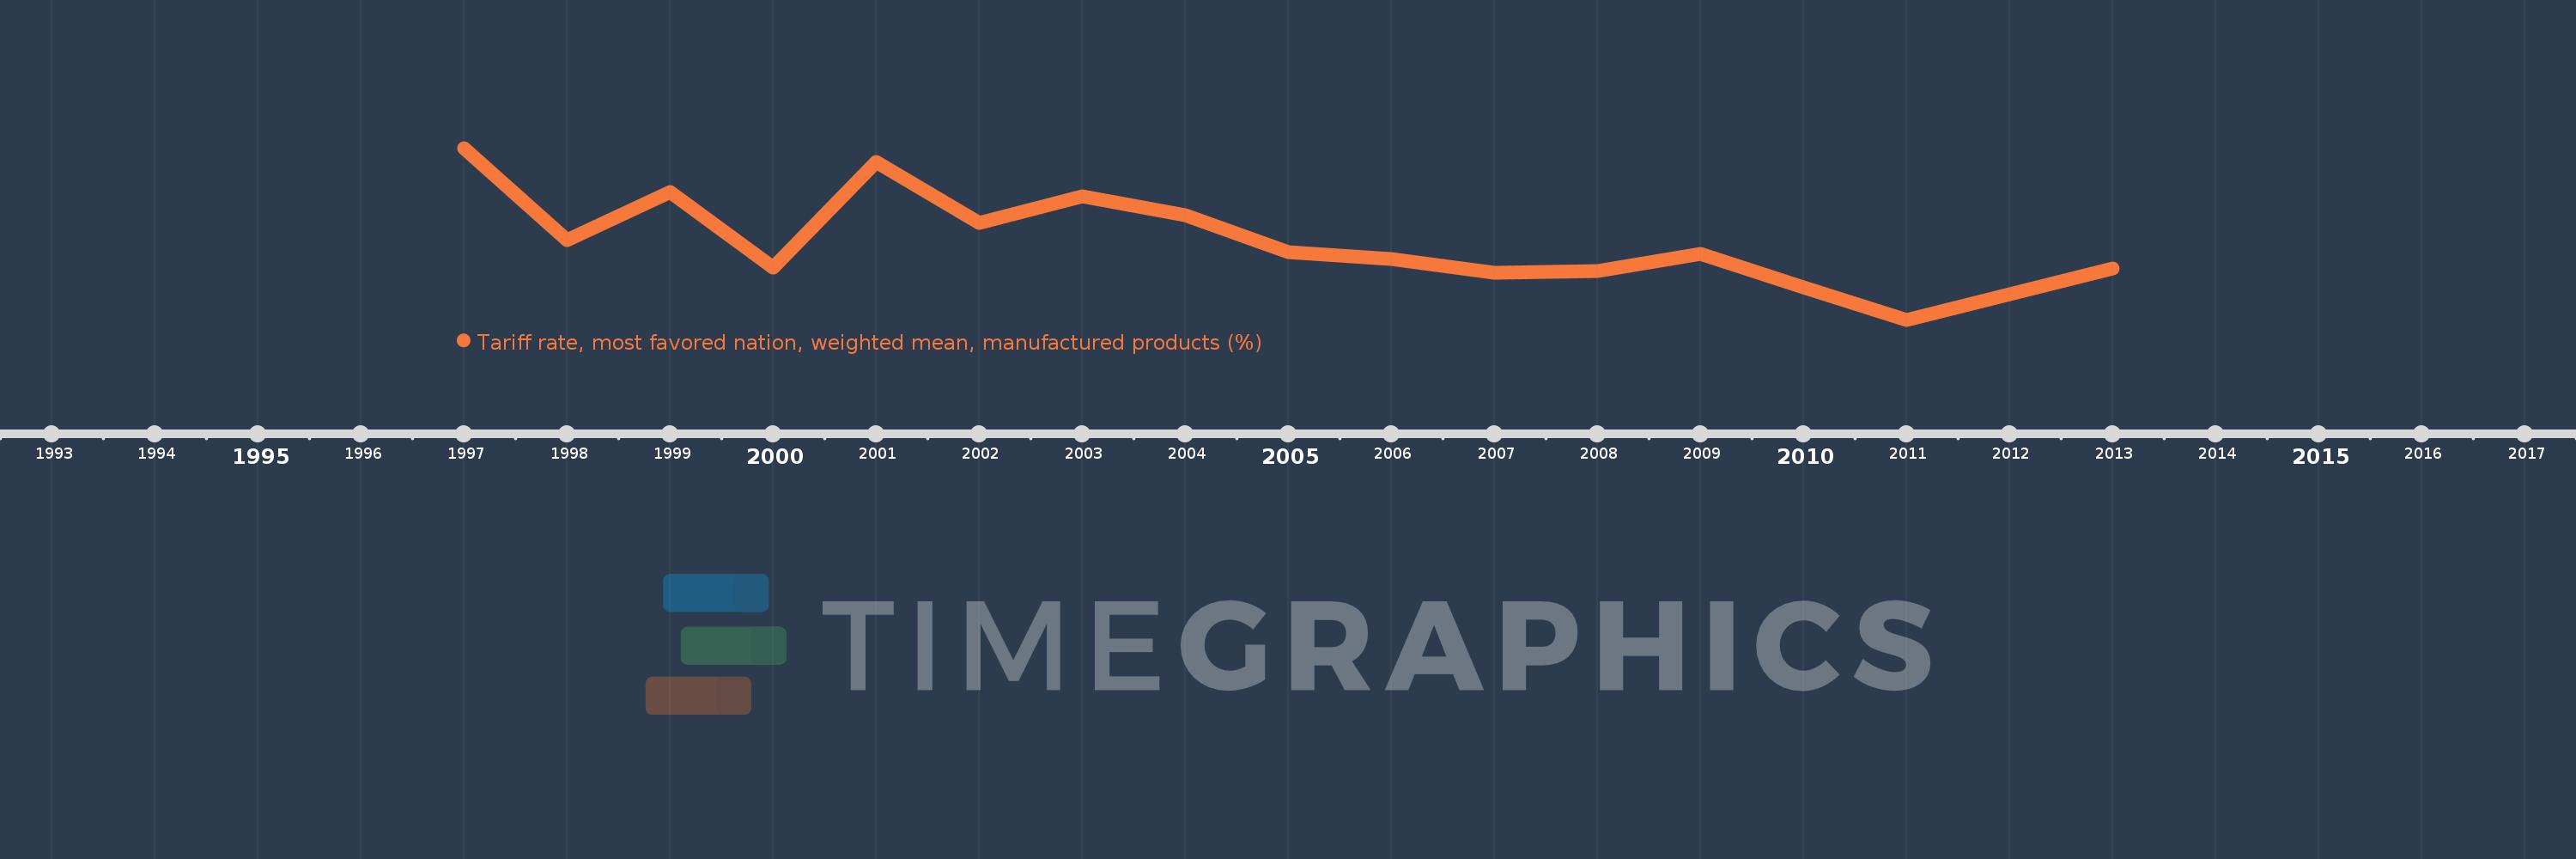
Tariff rate, most favored nation, weighted mean, manufactured products (%)
2013,2011,2010,2009,2008,2007,2006,2005,2004,2003,2002,2001,2000,1999,1998,1997