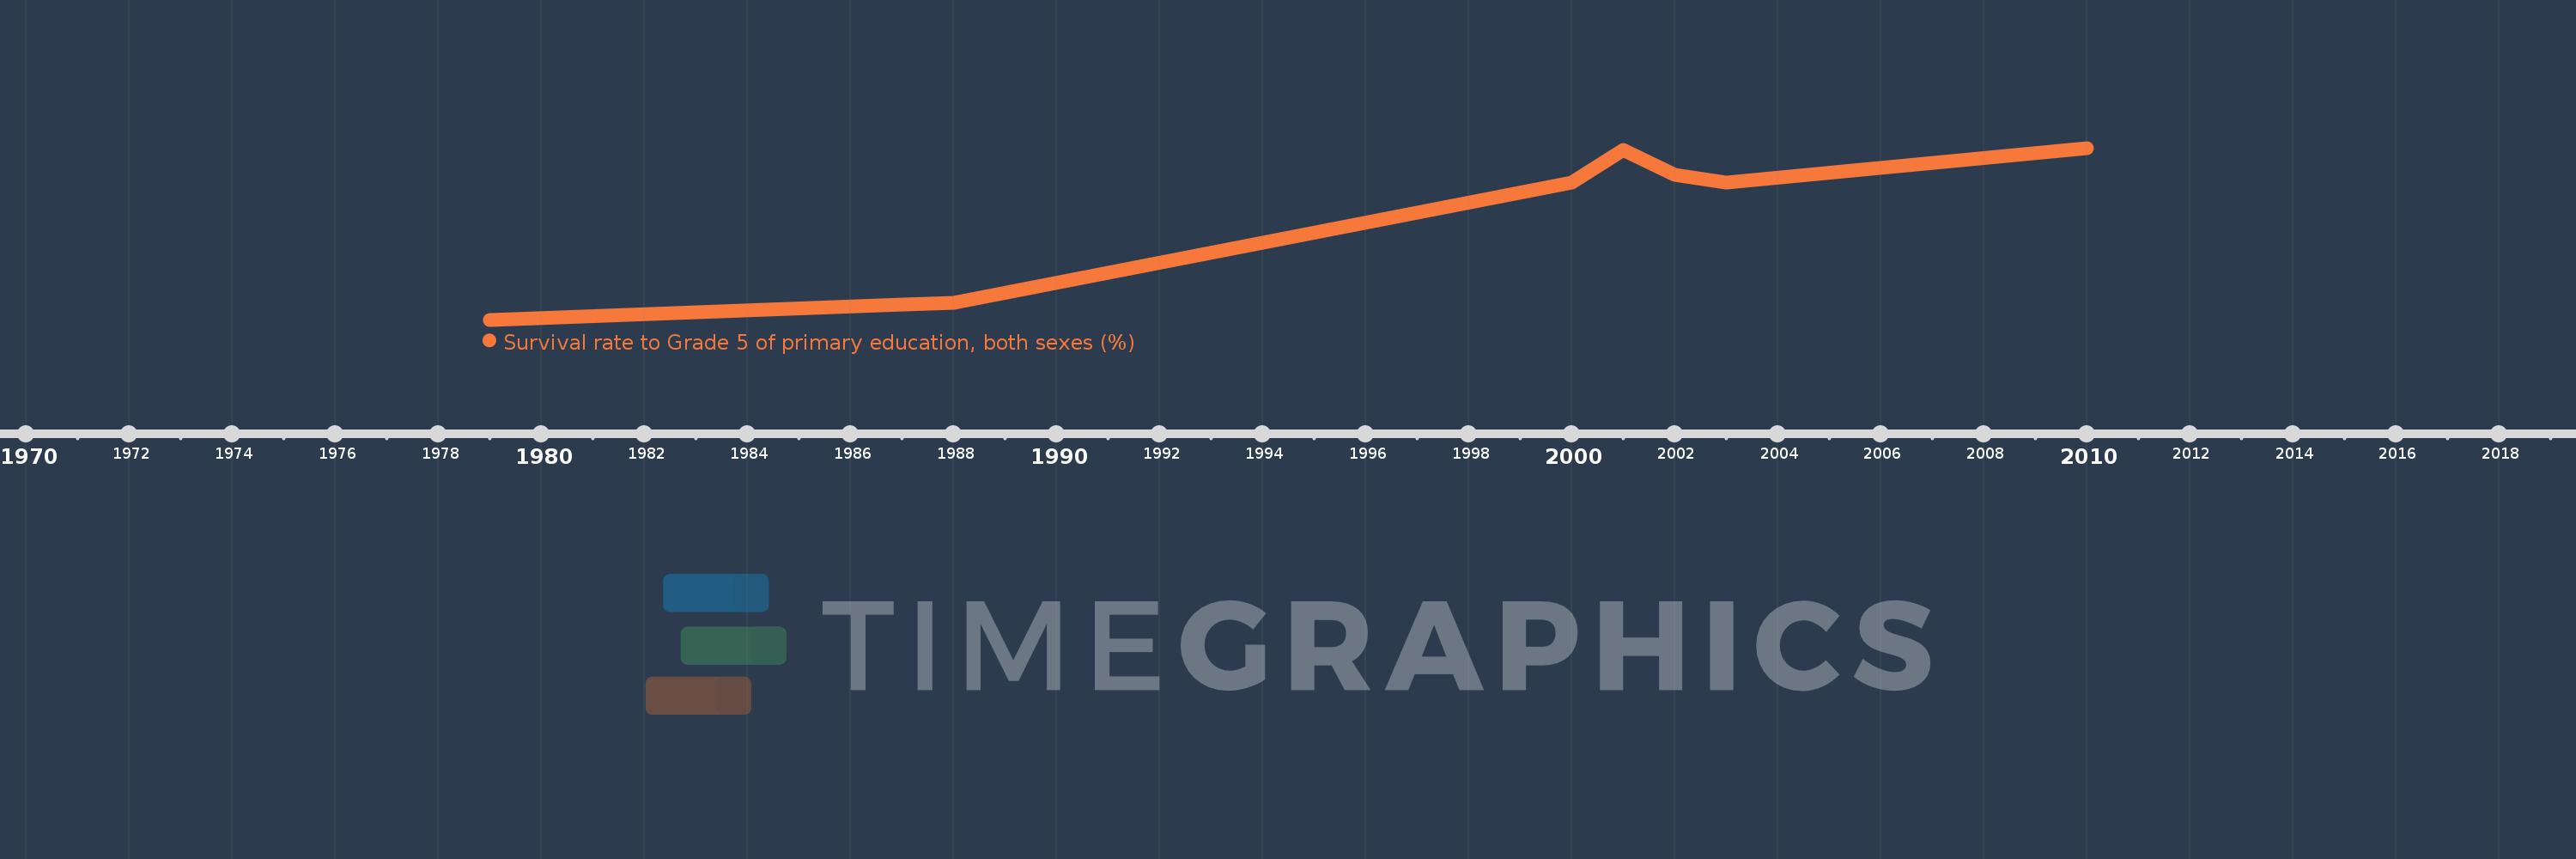
This timeline shows a graph from 1979 to 2010 of Middle East & North Africa (excluding high income). No data until 1978. Number of actual observations by date: 8.
Source name:
World Development Indicators
Source organization:
UNESCO Institute for Statistics
Categories, topics:
Education
Last updated:
apr 23, 2017
Indicators value changes by year
Meaning:
83.596
Minimum:
67.565
jan 1, 1979
Maximum:
95.358
jan 1, 2010
At the date of observation
Value
Absolute change
Change from the previous value
jan 1, 1979
67.565
+67.565
0.0%
jan 1, 1987
70.023
+2.458
3.64%
jan 1, 1988
70.259
+0.236
0.34%
jan 1, 2000
89.748
+19.489
27.74%
jan 1, 2001
95.011
+5.263
5.86%
jan 1, 2002
91.035
-3.976
-4.18%
jan 1, 2003
89.769
-1.266
-1.39%
jan 1, 2010
95.358
+5.589
6.23%
Ranking of countries by current statistics by years