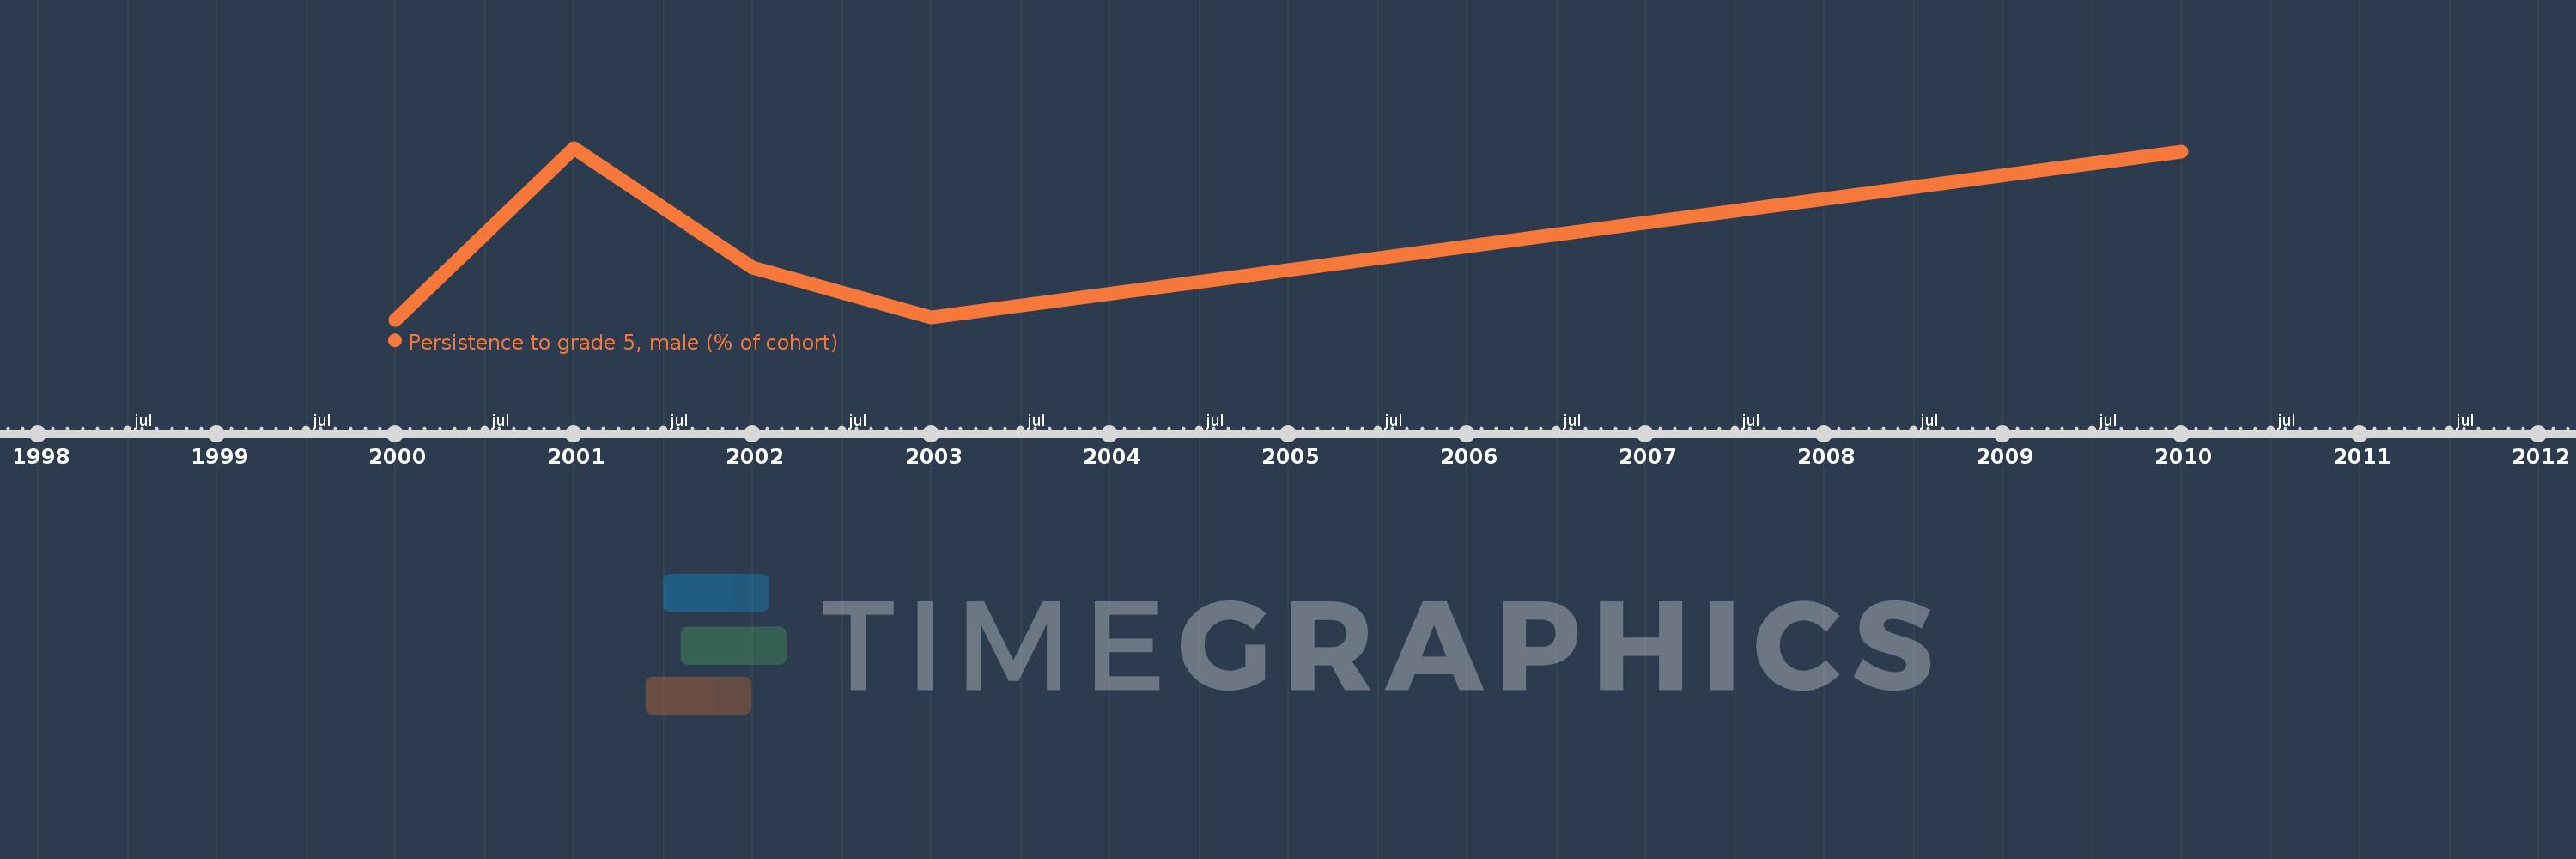
This timeline shows a graph from 2000 to 2010 of Middle East & North Africa (excluding high income). No data until 1999. Number of actual observations by date: 5.
Source name:
World Development Indicators
Source organization:
United Nations Educational, Scientific, and Cultural Organization (UNESCO) Institute for Statistics.
Categories, topics:
Education, Gender
Last updated:
apr 23, 2017
Indicators value changes by year
Meaning:
92.083
Minimum:
89.655
jan 1, 2000
Maximum:
94.949
jan 1, 2001
At the date of observation
Value
Absolute change
Change from the previous value
jan 1, 2000
89.655
+89.655
0.0%
jan 1, 2001
94.949
+5.294
5.9%
jan 1, 2002
91.271
-3.678
-3.87%
jan 1, 2003
89.716
-1.555
-1.7%
jan 1, 2010
94.825
+5.108
5.69%
Ranking of countries by current statistics by years