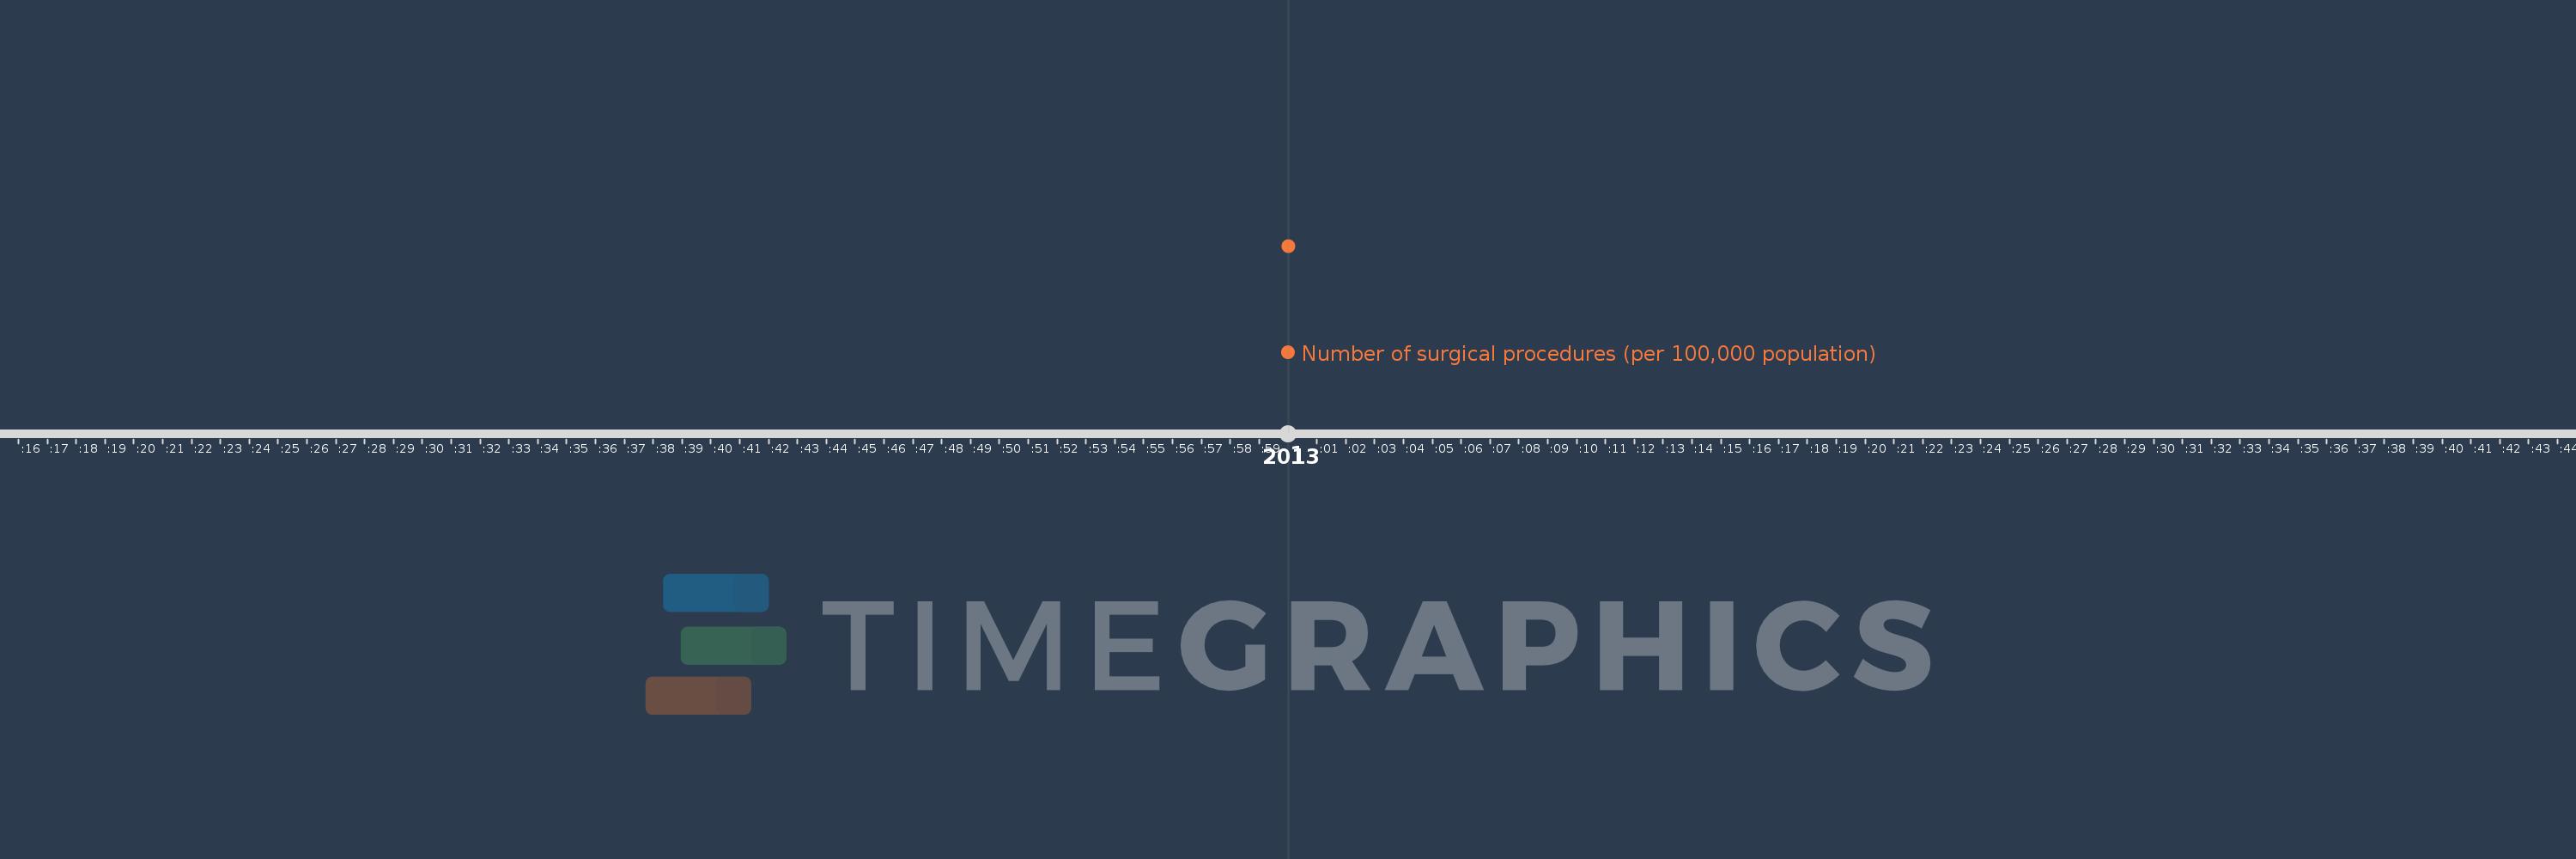
This timeline shows a graph from 2013 to 2013 of Middle East & North Africa (excluding high income). No data until 2012. Number of actual observations by date: 1.
Source name:
World Development Indicators
Source organization:
The Lancet Commission on Global Surgery (www.lancetglobalsurgery.org).
Categories, topics:
Health
Last updated:
apr 23, 2017
Indicators value changes by year
Meaning:
3.473K
Minimum:
3.473K
jan 1, 2013
Maximum:
3.473K
jan 1, 2013
At the date of observation
Value
Absolute change
Change from the previous value
jan 1, 2013
3.473K
+3.473K
0.0%
Ranking of countries by current statistics by years