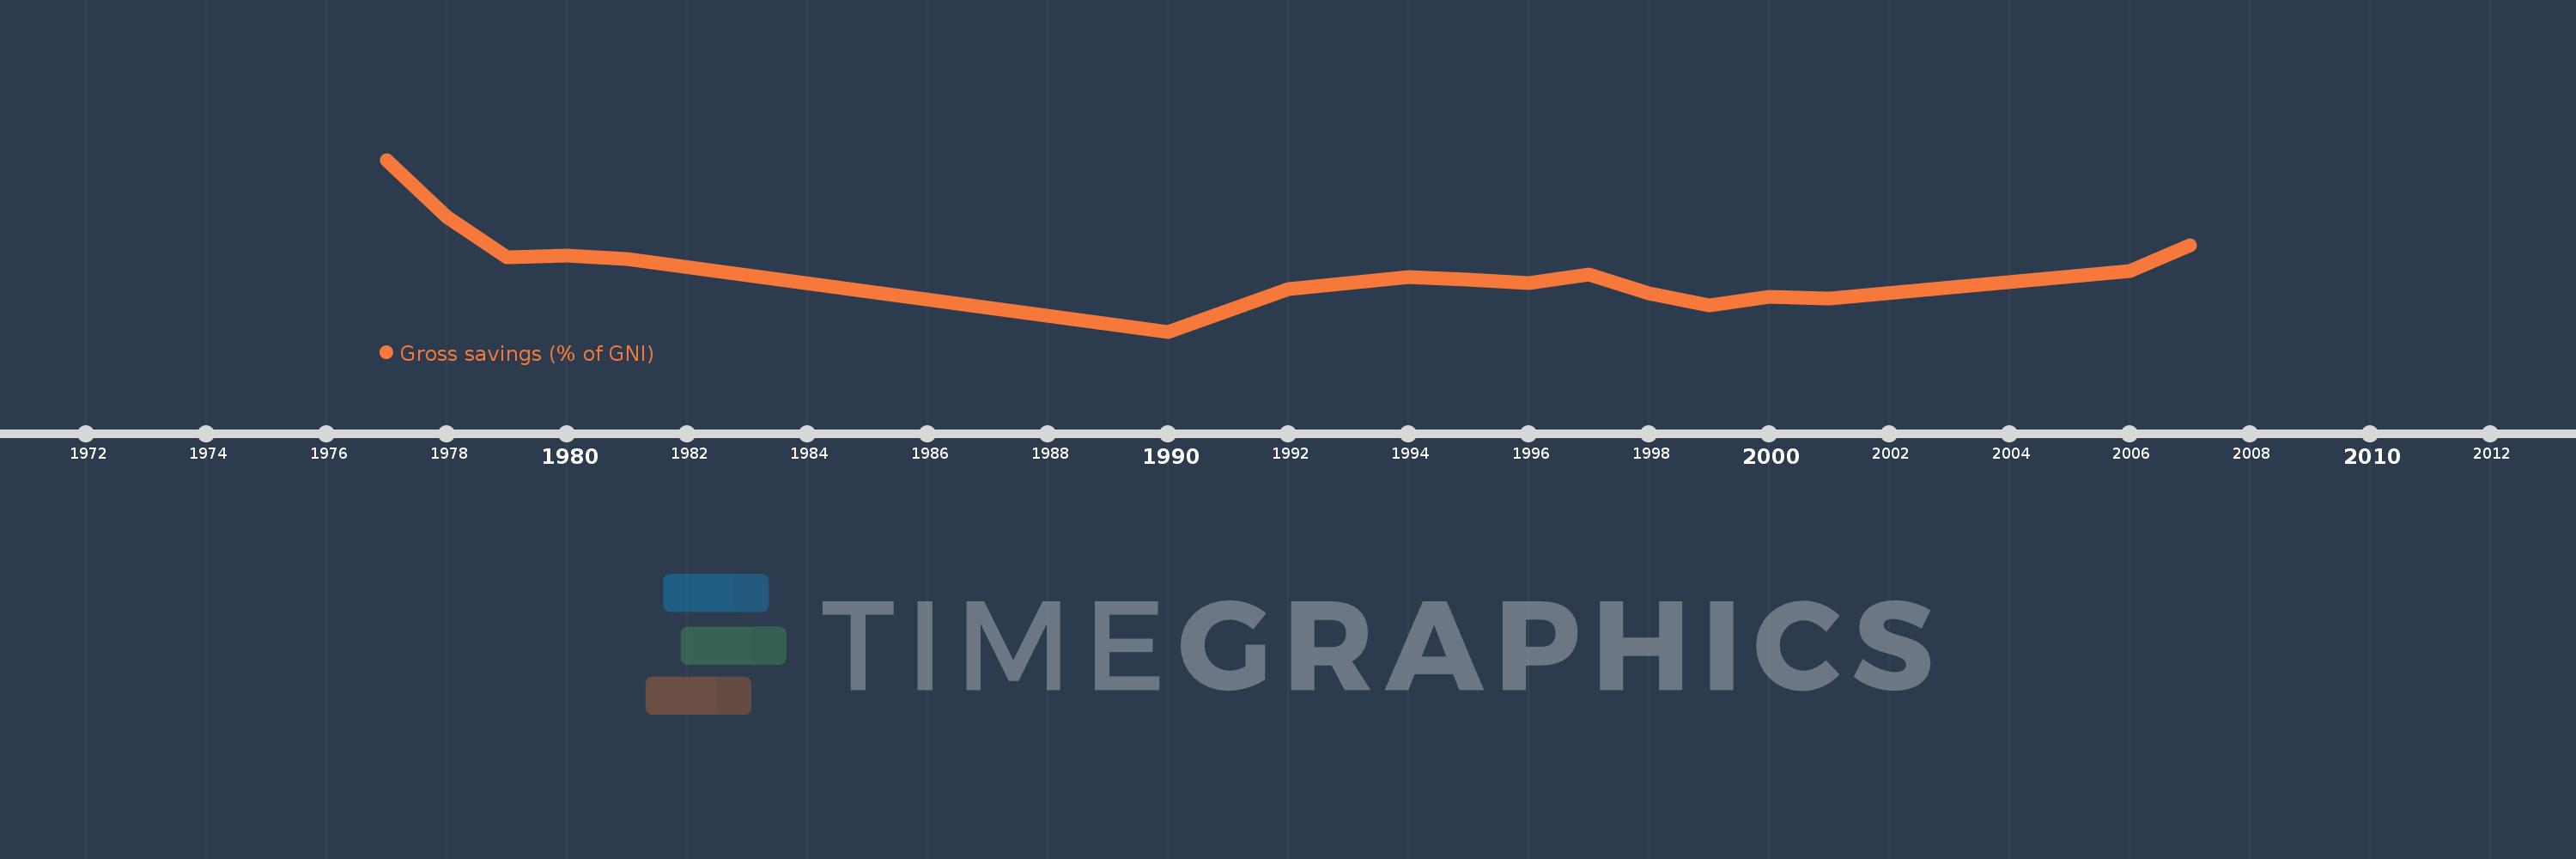
This timeline shows a graph from 1977 to 2007 of Middle East & North Africa (excluding high income). No data until 1976. Number of actual observations by date: 17.
Source name:
World Development Indicators
Source organization:
World Bank national accounts data, and OECD National Accounts data files.
Categories, topics:
Economy & Growth
Last updated:
apr 23, 2017
Indicators value changes by year
Meaning:
31.439
Minimum:
20.87
jan 1, 1990
Maximum:
50.446
jan 1, 1977
At the date of observation
Value
Absolute change
Change from the previous value
jan 1, 1977
50.446
+50.446
0.0%
jan 1, 1978
40.543
-9.903
-19.63%
jan 1, 1979
33.623
-6.92
-17.07%
jan 1, 1980
33.989
+0.367
1.09%
jan 1, 1981
33.433
-0.556
-1.64%
jan 1, 1990
20.87
-12.564
-37.58%
jan 1, 1992
28.236
+7.366
35.3%
jan 1, 1994
30.221
+1.985
7.03%
jan 1, 1995
29.764
-0.456
-1.51%
jan 1, 1996
29.298
-0.467
-1.57%
jan 1, 1997
30.684
+1.387
4.73%
jan 1, 1998
27.519
-3.165
-10.32%
jan 1, 1999
25.322
-2.197
-7.98%
jan 1, 2000
26.892
+1.57
6.2%
jan 1, 2001
26.548
-0.343
-1.28%
jan 1, 2006
31.352
+4.804
18.1%
jan 1, 2007
35.717
+4.365
13.92%
Ranking of countries by current statistics by years